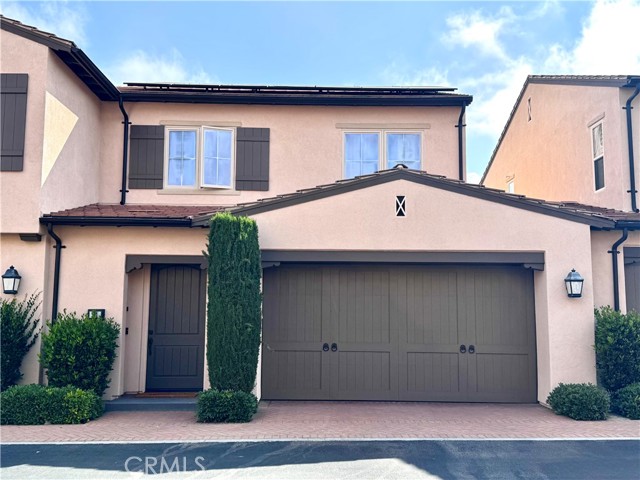
31 Shellbark, Irvine, CA 92618
31 Shellbark, Irvine, CA 92618
Property Description
Welcome to this beautifully upgraded residence in the desirable Stonegate East community of Irvine. Offering approximately 1,515 square feet of thoughtfully designed living space, this inviting home features 3 bedrooms, 2.5 bathrooms, and a bright, open-concept floor plan that seamlessly connects the living, dining, and kitchen areas. Tasteful upgrades, contemporary finishes, and abundant natural light create a comfortable and welcoming atmosphere throughout. A versatile bonus room provides additional flexibility for a home office, study, or personal retreat. The private backyard have a peaceful outdoor setting, perfect for relaxing, entertaining, or enjoying everyday moments.
Features & Amenities
Property Details
Mortgage Calculator
Current Rates
Comparative Market Analysis
Residential Tier · 5 active · 5 closed
Irvine · Condominium
Listed 3.6% below the median closed sale of $1,398,000. Price per sqft ($890) is a 15% premium to closed comps ($773).
Price Position
Aligned with the market — fair pricing for the comps.
Active Properties (5)
Active Comparables
| Address | City | Year | BD | BTH | SqFt | LotSz | LP/SqFt | LP | DIM | Score |
|---|---|---|---|---|---|---|---|---|---|---|
| 85 Thornhurst | Irvine | 2013 | 3 | 3 | 1,614 | 0 | $898 | $1.45M | 70 | 87 |
| 180 Follyhatch | Irvine | 2017 | 3 | 2 | 1,820 | 93,985 | $673 | $1.23M | 45 | 84 |
| 166 Groveland | Irvine | 2010 | 3 | 3 | 1,512 | 18,854 | $913 | $1.38M | 18 | 84 |
| 89 Kestrel | Irvine | 2015 | 3 | 4 | 1,860 | 24,776 | $688 | $1.28M | 34 | 82 |
| 100 Tenor | Irvine | 2021 | 3 | 4 | 1,718 | 26,577 | $681 | $1.17M | 31 | 82 |
| Total: 5 · Average | 3.0 | 3.2 | 1,704.8 | 41,048 | $770.6 | $1.30M | 39.6 | |||
| Median | 1,718 | $1.28M | ||||||||
Closed Properties (5)
Closed Comparables
| Address | City | Year | Date | BD | BTH | SqFt | LotSz | LP | SP | SP/SqFt | SP/LP | DIM | Score |
|---|---|---|---|---|---|---|---|---|---|---|---|---|---|
| 65 Kestrel | Irvine | 2016 | 01/07/2026 | 3 | 3 | 1,584 | 0 | $1.30M | $1.29M | $814 | 0.99 | 79 | 89 |
| 85 Kestrel | Irvine | 2015 | 10/16/2026 | 3 | 3 | 1,584 | 24,776 | $1.25M | $1.19M | $751 | 0.95 | 35 | 88 |
| 127 Bright Poppy | Irvine | 2014 | 10/14/2026 | 3 | 3 | 1,734 | 17,574 | $1.39M | $1.40M | $806 | 1.01 | 41 | 85 |
| 177 Bright Poppy | Irvine | 2015 | 09/02/2026 | 4 | 3 | 2,003 | 0 | $1.50M | $1.45M | $724 | 0.97 | 27 | 84 |
| 21 Deergrass | Irvine | 2011 | 01/09/2026 | 4 | 3 | 1,922 | 115,243 | $1.52M | $1.48M | $770 | 0.97 | 41 | 81 |
| Total: 5 · Average | 3.4 | 3.0 | 1,765.4 | 52,531 | $1.36M | $1.36M | $773 | — | 44.6 | ||||
| Median | 1,734 | $1.40M | $1.40M | ||||||||||
Market Analysis
List vs Sale $/SqFt
Sale Price Trend
Days on Market
Sale vs List Price
This analysis was generated automatically from MLS data. For an in-depth, human-reviewed valuation, contact Joseph Sardella at josephsardella@gmail.com.