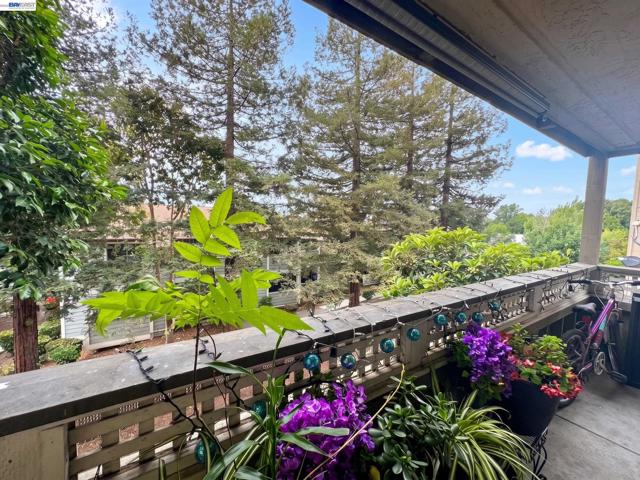
29599 Vanderbilt St, 204, Hayward, CA 94544
29599 Vanderbilt St, 204, Hayward, CA 94544
Property Description
Fully Renovated 2-Bedroom Condo – Exceptional Value in a Prime Location Welcome to this beautifully upgraded 2-bedroom, 1-bath condo offering the perfect blend of comfort, convenience, and value. Ideally located near BART, major shopping centers, Highway 880, and the scenic trails of Garin Regional Park, this home places you at the center of everything while still providing a peaceful residential setting. Inside, the property has been thoughtfully renovated with new flooring, fresh interior paint, a modernized kitchen and bathroom, and stylish countertops—delivering a clean, contemporary feel that is truly move-in ready.
Features & Amenities
Property Details
Mortgage Calculator
Current Rates
Comparative Market Analysis
Affordable Tier · 3 active · 5 closed
Hayward · Condominium
Listed 10.4% above the median closed sale of $425,000. Price per sqft ($521) is a 12% premium to closed comps ($465).
Price Position
Positioned above the market — commands a premium.
Active Properties (3)
Active Comparables
| Address | City | Year | BD | BTH | SqFt | LotSz | LP/SqFt | LP | DIM | Score |
|---|---|---|---|---|---|---|---|---|---|---|
| 411 Rhythm Ln | Hayward | 2021 | 1 | 1 | 429 | 9,212 | $932 | $399,888 | 44 | 68 |
| 2955 Risdon Dr | Union City | 1986 | 2 | 2 | 932 | 50,724 | $557 | $519,000 | 108 | 67 |
| 722 Kino Ct | Hayward | 1982 | 2 | 2 | 1,070 | 34,720 | $374 | $399,888 | 114 | 57 |
| Total: 3 · Average | 1.7 | 1.7 | 810.333 | 31,552 | $621 | $439,592 | 88.66666666666667 | |||
| Median | 932 | $399,888 | ||||||||
Closed Properties (5)
Closed Comparables
| Address | City | Year | Date | BD | BTH | SqFt | LotSz | LP | SP | SP/SqFt | SP/LP | DIM | Score |
|---|---|---|---|---|---|---|---|---|---|---|---|---|---|
| 715 Heath Ct | Hayward | 1988 | 07/13/2026 | 2 | 2 | 906 | 8,634 | $495,000 | $495,000 | $546 | 1.00 | 46 | 90 |
| 27949 Thornton Ct | Hayward | 1986 | 08/06/2026 | 2 | 1 | 900 | 60,882 | $399,999 | $400,000 | $444 | 1.00 | 30 | 79 |
| 27427 Stoneridge Court | Hayward | 1984 | 08/26/2026 | 2 | 2 | 1,008 | 32,334 | $425,000 | $425,000 | $422 | 1.00 | 34 | 75 |
| 27787 Vasona Ct | Hayward | 1985 | 09/21/2026 | 1 | 2 | 874 | 69,461 | $399,000 | $399,000 | $457 | 1.00 | 74 | 74 |
| 26 Raintree Ct | Hayward | 1986 | 08/19/2026 | 3 | 2 | 1,100 | 90,850 | $499,000 | $499,900 | $454 | 1.00 | 72 | 72 |
| Total: 5 · Average | 2.0 | 1.8 | 957.6 | 52,432.2 | $443,780 | $443,780 | $464.6 | — | 51.2 | ||||
| Median | 906 | $425,000 | $425,000 | ||||||||||
Market Analysis
List vs Sale $/SqFt
Sale Price Trend
Days on Market
Sale vs List Price
This analysis was generated automatically from MLS data. For an in-depth, human-reviewed valuation, contact Joseph Sardella at josephsardella@gmail.com.