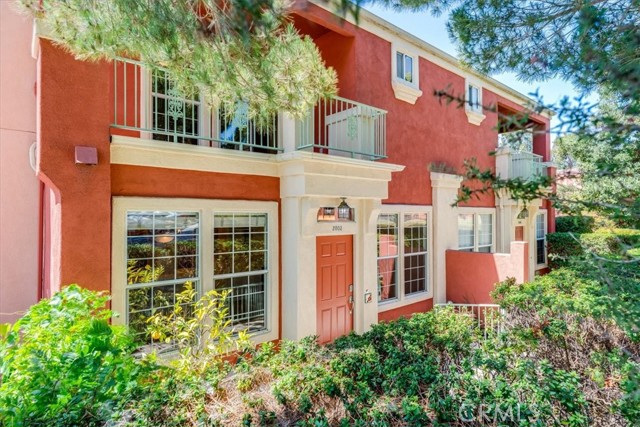
2803 Garibaldi Avenue, San Luis Obispo, CA 93401
2803 Garibaldi Avenue, San Luis Obispo, CA 93401
Property Description
Take another look! Mediterranean-styled community setting and so close to Downtown SLO! In the Villa Rosa complex is this sparkling clean expansive 3 bedroom 3 bath home. Generous front patio and upstairs deck off ensuite primary bedroom. Some highlights are abundant built-in cabinetry in convenient locations, fireplace, upstairs laundry, 2 car garage with outlet for potential car charger. Close to greenbelt and guest parking area. Recent paint and carpet install. South SLO Location is ideal for access to sought-after schools, airport, proximity to recreation and open space. Common areas include a sport court, play structure, picnic area, walking paths, attentively maintained landscaping. HOA of $475/mo. for exterior insurance and exterior maintenance makes for convenient living. Square footage source is County Records.
Features & Amenities
Property Details
Mortgage Calculator
Current Rates
Comparative Market Analysis
Affordable Tier · 3 active · 5 closed
San Luis Obispo · Townhouse
Listed 3.2% above the median closed sale of $785,000.
Price Position
Aligned with the market — fair pricing for the comps.
Active Properties (3)
Active Comparables
| Address | City | Year | BD | BTH | SqFt | LotSz | LP/SqFt | LP | DIM | Score |
|---|---|---|---|---|---|---|---|---|---|---|
| 720 Leff | San Luis Obispo | 1979 | 3 | 3 | 1,518 | 1,129 | $527 | $799,900 | 83 | 82 |
| 3816 Hatchery Lane | San Luis Obispo | 2021 | 3 | 3 | 1,673 | 1,632 | $537 | $899,000 | 129 | 82 |
| 261 Via La Paz | San Luis Obispo | 1988 | 2 | 3 | 1,341 | 2,178 | $551 | $739,000 | 44 | 80 |
| Total: 3 · Average | 2.7 | 3.0 | 1,510.667 | 1,646.333 | $538.333 | $812,633.333 | 85.33333333333333 | |||
| Median | 1,518 | $799,900 | ||||||||
Closed Properties (5)
Closed Comparables
| Address | City | Year | Date | BD | BTH | SqFt | LotSz | LP | SP | SP/SqFt | SP/LP | DIM | Score |
|---|---|---|---|---|---|---|---|---|---|---|---|---|---|
| 2864 Victoria Avenue | San Luis Obispo | 2000 | 10/30/2026 | 2 | 3 | 1,396 | 1,164 | $699,000 | $699,000 | $501 | 1.00 | 36 | 91 |
| 950 Tarragon | San Luis Obispo | 2010 | 03/31/2026 | 3 | 3 | 1,417 | 1,417 | $724,000 | $699,000 | $493 | 0.96 | 53 | 89 |
| 1182 Tiburon | San Luis Obispo | 2023 | 11/02/2026 | 3 | 3 | 1,651 | 1,802 | $799,000 | $799,000 | $484 | 1.00 | 98 | 83 |
| 1033 Tiburon | San Luis Obispo | 2022 | 09/17/2026 | 3 | 3 | 1,651 | 1,672 | $775,000 | $785,000 | $475 | 1.01 | 71 | 83 |
| 1225 Sponza Dr | San Luis Obispo | 2022 | 09/22/2026 | 3 | 3 | 1,713 | 1,610 | $919,000 | $910,000 | $531 | 0.99 | 95 | 83 |
| Total: 5 · Average | 2.8 | 3.0 | 1,565.6 | 1,533 | $778,400 | $778,400 | $496.8 | — | 70.6 | ||||
| Median | 1,651 | $785,000 | $785,000 | ||||||||||
Market Analysis
List vs Sale $/SqFt
Sale Price Trend
Days on Market
Sale vs List Price
This analysis was generated automatically from MLS data. For an in-depth, human-reviewed valuation, contact Joseph Sardella at josephsardella@gmail.com.