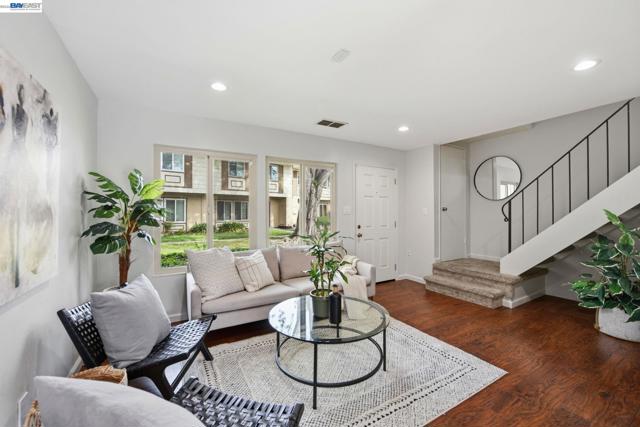
27864 Hummingbird Ct, Hayward, CA
27864 Hummingbird Ct, Hayward, CA
Property Description
Welcome to this beautifully refreshed northwest-facing 2-bedroom, 1.5-bath townhome blending style, comfort, and everyday practicality in a desirable Hayward location. This home features an upgraded kitchen with newer cabinetry, added storage and functionality, and lightly used appliances approximately 2–3 years old. Fresh interior paint, recessed lighting, and laminate flooring create a bright and inviting atmosphere throughout. Additional highlights include in-unit stackable laundry and a newer water heater. Newly installed drywall in both the front utility closet—which houses the unit’s gas and water meters—and the rear backyard storage closet gives these areas a clean, refreshed finish. The private backyard features recently installed concrete for low-maintenance outdoor living, a dedicated area ideal for gardening or adding personal touches, and a charming lemon tree. Two covered parking spaces are conveniently located near the unit. Ideally situated near the San Mateo Bridge, Interstate 880, hospitals, grocery stores, parks, Costco, Chabot College, shopping, dining, and other everyday essentials, this home offers excellent convenience for commuters and residents alike.
Features & Amenities
Property Details
Mortgage Calculator
Current Rates
Comparative Market Analysis
Affordable Tier · 1 active · 5 closed
Hayward · Townhouse
Listed 7.3% below the median closed sale of $620,000. Price per sqft ($582) is a 11% premium to closed comps ($523). Closed comps sold at 104% of list — strong seller's market.
Price Position
Priced below the market — value advantage over the field.
Active Properties (1)
Active Comparables
| Address | City | Year | BD | BTH | SqFt | LotSz | LP/SqFt | LP | DIM | Score |
|---|---|---|---|---|---|---|---|---|---|---|
| 4424 Alamo St | Union City | 1971 | 2 | 1 | 875 | 1,896 | $657 | $575,000 | 6 | 65 |
| Total: 1 · Average | 2.0 | 1.0 | 875 | 1,896 | $657 | $575,000 | 6 | |||
| Median | 875 | $575,000 | ||||||||
Closed Properties (5)
Closed Comparables
| Address | City | Year | Date | BD | BTH | SqFt | LotSz | LP | SP | SP/SqFt | SP/LP | DIM | Score |
|---|---|---|---|---|---|---|---|---|---|---|---|---|---|
| 2443 Oliver Dr | Hayward | 1970 | 07/29/2026 | 2 | 2 | 988 | 817 | $558,000 | $568,000 | $575 | 1.02 | 48 | 93 |
| 2363 Arf Ave | Hayward | 1970 | 01/16/2026 | 2 | 2 | 988 | 817 | $529,000 | $570,000 | $577 | 1.08 | 27 | 88 |
| 2465 Arf Ave | Hayward | 1970 | 07/15/2026 | 3 | 2 | 1,254 | 946 | $599,950 | $635,000 | $506 | 1.06 | 47 | 83 |
| 27818 Del Norte Ct | Hayward | 1970 | 07/08/2026 | 3 | 2 | 1,220 | 2,255 | $599,000 | $640,000 | $525 | 1.07 | 42 | 80 |
| 27803 Hummingbird Ct | Hayward | 1971 | 08/31/2026 | 3 | 2 | 1,440 | 1,080 | $629,000 | $620,000 | $431 | 0.99 | 40 | 80 |
| Total: 5 · Average | 2.6 | 2.0 | 1,178 | 1,183 | $606,600 | $606,600 | $522.8 | — | 40.8 | ||||
| Median | 1,220 | $620,000 | $620,000 | ||||||||||
Market Analysis
List vs Sale $/SqFt
Sale Price Trend
Days on Market
Sale vs List Price
This analysis was generated automatically from MLS data. For an in-depth, human-reviewed valuation, contact Joseph Sardella at josephsardella@gmail.com.