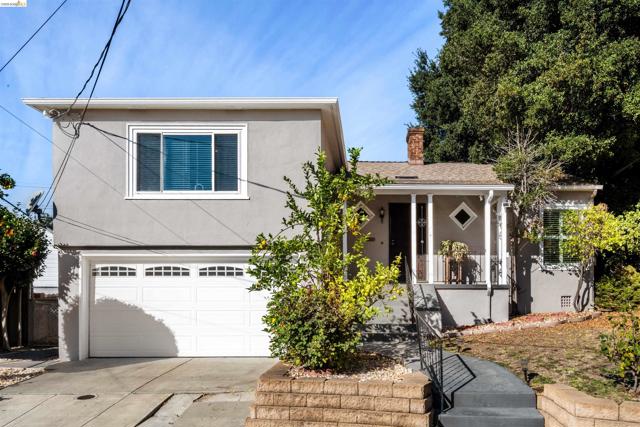
2739 Inyo, Oakland, CA
2739 Inyo, Oakland, CA
Property Description
Built in 1939, this charming 2 BR house sits at the end of a cul de sac. Entertain family & friends around the cozy fireplace in the spacious living room or gather in the formal dining area for an intimate meal. The kitchen has stainless steel appliances, double oven, granite countertops and plenty of cabinet space for the home chef. This is a great opportunity to start the holiday season in a new home.
Features & Amenities
Property Details
Mortgage Calculator
Current Rates
Comparative Market Analysis
Affordable Tier · 5 active · 5 closed
Oakland · Single Family Residence
Listed in line with the median closed sale of $639,000. Price per sqft ($500) is a 14% discount to closed comps ($579). Closed comps sold at 114% of list — strong seller's market.
Price Position
Aligned with the market — fair pricing for the comps.
Active Properties (5)
Active Comparables
| Address | City | Year | BD | BTH | SqFt | LotSz | LP/SqFt | LP | DIM | Score |
|---|---|---|---|---|---|---|---|---|---|---|
| 2901 Sheffield Ave | Oakland | 1939 | 2 | 1 | 1,103 | 3,120 | $534 | $589,000 | 31 | 88 |
| 2521 24Th Ave | Oakland | 1941 | 2 | 1 | 1,040 | 5,400 | $595 | $619,000 | 66 | 86 |
| 2712 Logan St | Oakland | 1925 | 3 | 2 | 1,119 | 3,885 | $603 | $675,000 | 4 | 85 |
| 2300 47th AVE | Oakland | 1937 | 2 | 2 | 1,270 | 5,548 | $511 | $649,000 | 10 | 82 |
| 1409 29th | Oakland | 1919 | 3 | 2 | 1,188 | 3,500 | $503 | $598,000 | 2 | 79 |
| Total: 5 · Average | 2.4 | 1.6 | 1,144 | 4,290.6 | $549.2 | $626,000 | 22.6 | |||
| Median | 1,119 | $619,000 | ||||||||
Closed Properties (5)
Closed Comparables
| Address | City | Year | Date | BD | BTH | SqFt | LotSz | LP | SP | SP/SqFt | SP/LP | DIM | Score |
|---|---|---|---|---|---|---|---|---|---|---|---|---|---|
| 2633 22nd Ave | Oakland | 1926 | 08/14/2026 | 2 | 2 | 1,206 | 5,074 | $679,000 | $679,000 | $563 | 1.00 | 78 | 90 |
| 2700 26Th Ave | Oakland | 1924 | 04/15/2026 | 2 | 2 | 1,154 | 4,094 | $699,888 | $710,000 | $615 | 1.01 | 84 | 88 |
| 2732 Garden St | Oakland | 1928 | 08/13/2026 | 2 | 1 | 1,109 | 3,885 | $549,950 | $634,050 | $572 | 1.15 | 69 | 86 |
| 2227 27Th St | Oakland | 1918 | 09/04/2026 | 2 | 2 | 930 | 2,679 | $399,000 | $605,000 | $651 | 1.52 | 37 | 82 |
| 2635 19Th Ave | Oakland | 1925 | 07/22/2026 | 3 | 1 | 1,293 | 3,720 | $629,000 | $639,000 | $494 | 1.02 | 51 | 82 |
| Total: 5 · Average | 2.2 | 1.6 | 1,138.4 | 3,890.4 | $653,410 | $653,410 | $579 | — | 63.8 | ||||
| Median | 1,154 | $639,000 | $639,000 | ||||||||||
Market Analysis
List vs Sale $/SqFt
Sale Price Trend
Days on Market
Sale vs List Price
This analysis was generated automatically from MLS data. For an in-depth, human-reviewed valuation, contact Joseph Sardella at josephsardella@gmail.com.