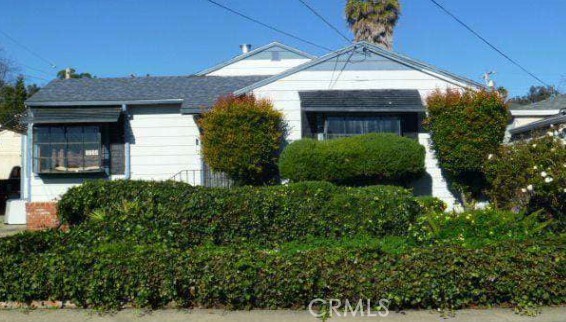
2735 Truman, Oakland, CA 94605
2735 Truman, Oakland, CA 94605
Property Description
Great Opportunity to own this single-family home in Oakland, CA. This home was built in 1944 featuring 3 bedrooms and 1.5 bathrooms. ***SPECIAL NOTES: (1) This is a CASH ONLY transaction. (2) Seller to pay Taxes, HOA, and Municipal/Utility Liens. (3) Please read the Auction disclaimers carefully before placing a bid or submitting an offer. ***
Features & Amenities
Property Details
Mortgage Calculator
Current Rates
Comparative Market Analysis
Affordable Tier · 5 active · 5 closed
Oakland · Single Family Residence
Listed 5.4% below the median closed sale of $510,000. Price per sqft ($316) is a 31% discount to closed comps ($458). Closed comps sold at 109% of list — strong seller's market.
Price Position
Priced below the market — value advantage over the field.
Active Properties (5)
Active Comparables
| Address | City | Year | BD | BTH | SqFt | LotSz | LP/SqFt | LP | DIM | Score |
|---|---|---|---|---|---|---|---|---|---|---|
| 9220 Cherry | Oakland | 1938 | 3 | 2 | 1,634 | 5,080 | $336 | $549,000 | 261 | 83 |
| 2414 107Th Ave | Oakland | 1940 | 3 | 1 | 1,044 | 4,040 | $478 | $499,000 | 128 | 78 |
| 1360 99th ave | Oakland | 1919 | 3 | 2 | 1,014 | 3,290 | $542 | $549,900 | 331 | 70 |
| 1480 77Th Ave | Oakland | 1923 | 3 | 2 | 1,060 | 3,350 | $460 | $488,000 | 45 | 69 |
| 1211 96Th Ave | Oakland | 1940 | 2 | 1 | 950 | 3,990 | $474 | $450,000 | 73 | 68 |
| Total: 5 · Average | 2.8 | 1.6 | 1,140.4 | 3,950 | $458 | $507,180 | 167.6 | |||
| Median | 1,044 | $499,000 | ||||||||
Closed Properties (5)
Closed Comparables
| Address | City | Year | Date | BD | BTH | SqFt | LotSz | LP | SP | SP/SqFt | SP/LP | DIM | Score |
|---|---|---|---|---|---|---|---|---|---|---|---|---|---|
| 9821 Thermal Street | Oakland | 1924 | 09/14/2026 | 3 | 2 | 1,305 | 6,250 | $449,000 | $510,000 | $391 | 1.14 | 46 | 85 |
| 2380 107th Avenue | Oakland | 1928 | 01/12/2026 | 3 | 2 | 1,551 | 4,007 | $499,000 | $500,000 | $322 | 1.00 | 48 | 85 |
| 2331 Warner Ave | Oakland | 1946 | 12/09/2025 | 3 | 1 | 1,416 | 5,000 | $495,000 | $550,000 | $388 | 1.11 | 52 | 80 |
| 9814 Springfield St | Oakland | 1941 | 05/19/2026 | 2 | 1 | 890 | 5,320 | $449,000 | $535,000 | $601 | 1.19 | 54 | 75 |
| 2111 100Th Ave | Oakland | 1953 | 10/13/2026 | 2 | 1 | 830 | 3,475 | $490,000 | $490,000 | $590 | 1.00 | 38 | 71 |
| Total: 5 · Average | 2.6 | 1.4 | 1,198.4 | 4,810.4 | $517,000 | $517,000 | $458.4 | — | 47.6 | ||||
| Median | 1,305 | $510,000 | $510,000 | ||||||||||
Market Analysis
List vs Sale $/SqFt
Sale Price Trend
Days on Market
Sale vs List Price
This analysis was generated automatically from MLS data. For an in-depth, human-reviewed valuation, contact Joseph Sardella at josephsardella@gmail.com.