273 Beauforest Dr, Oakland, CA 94611
273 Beauforest Dr, Oakland, CA 94611
Property Description
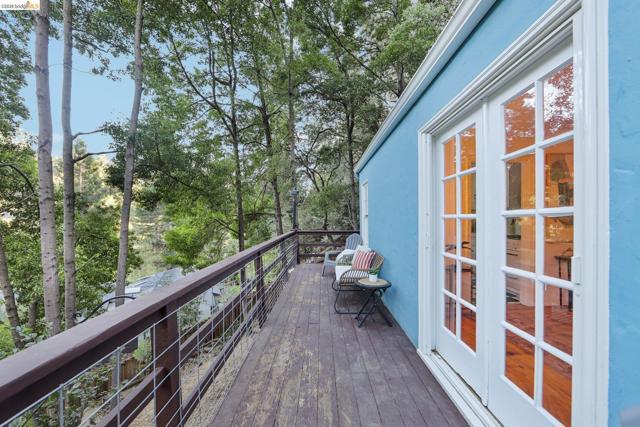
This charming 1930s cottage is set on an expansive, tree-surrounded double lot that feels like your own private forest hideaway. Featuring a seamless blend of vintage character and modern utility, the property includes a ready-to-use chicken coop, raised garden beds, and fenced areas for pets. French doors open from the living space onto a front deck offering tranquil valley views—the ideal spot for morning coffee. Out back, a private patio anchored by an outdoor fireplace provides the ultimate setting for relaxing or entertaining friends. Downstairs, a versatile private lower level with its own separate entrance and laundry hookups is primed to become a home office, or home gym. Enjoy the peace and privacy of a standalone home, all just minutes from Thornhill shops, Montclair Village, local schools, and major freeway. Plus the possibility to build another home its great for a homeowner seeking privacy or investor looking to add a home.
Features & Amenities
Property Details
Mortgage Calculator
Current Rates
Comparative Market Analysis
Affordable Tier · 5 active · 5 closed
Oakland · Single Family Residence
Listed 8.7% below the median closed sale of $750,000. Price per sqft ($1,354) is a 227% premium to closed comps ($414). Closed comps sold at 94% of list — buyers have negotiating leverage.
Price Position
Priced below the market — value advantage over the field.
Active Properties (5)
Active Comparables
| Address | City | Year | BD | BTH | SqFt | LotSz | LP/SqFt | LP | DIM | Score |
|---|---|---|---|---|---|---|---|---|---|---|
| 5430 Estates DR | Oakland | 1917 | 1 | 1 | 648 | 10,643 | $923 | $598,000 | 59 | 72 |
| 6912 Balsam Way | Oakland | 1922 | 2 | 2 | 1,346 | 6,804 | $519 | $699,000 | 18 | 57 |
| 6139 Westover Dr | Oakland | 1965 | 3 | 3 | 2,331 | 8,008 | $290 | $675,000 | 3 | 45 |
| 331 42nd Street | Oakland | 1923 | 3 | 1 | 1,087 | 4,092 | $643 | $699,000 | 12 | 40 |
| 190 Northern Railway | 1920 | 3 | 1 | 1,360 | 7,659 | $511 | $695,000 | 366 | 33 | |
| Total: 5 · Average | 2.4 | 1.6 | 1,354.4 | 7,441.2 | $577.2 | $673,200 | 91.6 | |||
| Median | 1,346 | $695,000 | ||||||||
Closed Properties (5)
Closed Comparables
| Address | City | Year | Date | BD | BTH | SqFt | LotSz | LP | SP | SP/SqFt | SP/LP | DIM | Score |
|---|---|---|---|---|---|---|---|---|---|---|---|---|---|
| 7279 Snake Rd | Oakland | 1959 | 06/25/2026 | 3 | 2 | 1,585 | 8,250 | $649,000 | $750,000 | $473 | 1.16 | 20 | 51 |
| 6956 Sayre Drive | Oakland | 1964 | 05/12/2026 | 3 | 2 | 2,080 | 7,672 | $780,000 | $780,000 | $375 | 1.00 | 76 | 45 |
| 7403 Skyline Blvd | Oakland | 1965 | 11/24/2025 | 2 | 3 | 1,886 | 2,295 | $695,000 | $600,000 | $318 | 0.86 | 46 | 42 |
| 33 Eastwood Ct | Oakland | 1970 | 07/14/2026 | 3 | 2 | 1,547 | 5,980 | $839,000 | $770,000 | $498 | 0.92 | 62 | 42 |
| 6334 Doran Dr | Oakland | 1966 | 05/19/2026 | 3 | 3 | 1,532 | 6,448 | $799,000 | $625,000 | $408 | 0.78 | 22 | 40 |
| Total: 5 · Average | 2.8 | 2.4 | 1,726 | 6,129 | $705,000 | $705,000 | $414.4 | — | 45.2 | ||||
| Median | 1,585 | $750,000 | $750,000 | ||||||||||
Market Analysis
List vs Sale $/SqFt
Sale Price Trend
Days on Market
Sale vs List Price
This analysis was generated automatically from MLS data. For an in-depth, human-reviewed valuation, contact Joseph Sardella at josephsardella@gmail.com.