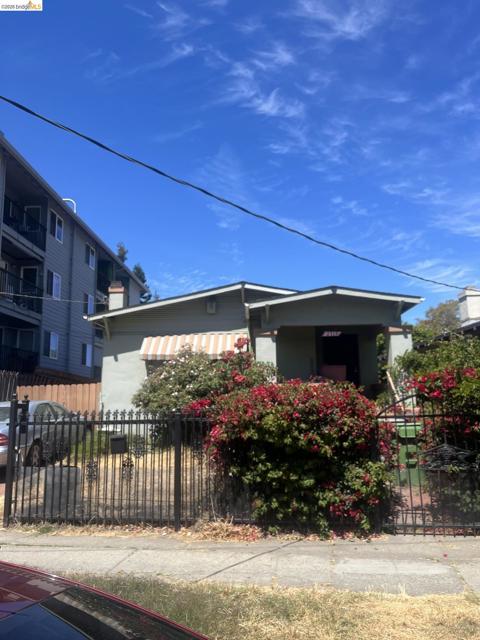
2715 high, Oakland, CA 94601
2715 high, Oakland, CA 94601
Property Description
This property has been placed in an upcoming online event. All bids should be submitted at www.xome.com (void where prohibited). All offers received prior to the event period should be submitted by the buyer or buyer's agent by clicking on the “Make Offer” button on the Property Details page on Xome.com. All offers will be reviewed and responded to within 3 business days. All properties are subject to a 5% buyer’s premium pursuant to the Auction Participation Agreement and Terms & Conditions (minimums will apply). A home with classic vintage character and a calm, enduring presence, ready for its next chapter. Warm hardwood floors extend through much of the interior, and a traditional fireplace anchors the living room, offering timeless architectural appeal and a natural gathering space. The property retains many original features and presents a wonderful opportunity for thoughtful updates and refinement. Also the garage was converted to an ADU studio.
Features & Amenities
Property Details
Mortgage Calculator
Current Rates
Comparative Market Analysis
Affordable Tier · 5 active · 5 closed
Oakland · Single Family Residence
Listed in line with the median closed sale of $642,000. Price per sqft ($505) is a 14% discount to closed comps ($585). Closed comps sold at 110% of list — strong seller's market.
Price Position
Aligned with the market — fair pricing for the comps.
Active Properties (5)
Active Comparables
| Address | City | Year | BD | BTH | SqFt | LotSz | LP/SqFt | LP | DIM | Score |
|---|---|---|---|---|---|---|---|---|---|---|
| 4315 Fleming AVE | Oakland | 1925 | 2 | 1 | 1,189 | 3,914 | $596 | $709,000 | 65 | 94 |
| 4117 Penniman Ct #G | Oakland | 1925 | 2 | 2 | 1,173 | 3,456 | $511 | $599,000 | 80 | 90 |
| 4628 Congress Ave | Oakland | 1925 | 2 | 1 | 1,037 | 3,800 | $627 | $649,999 | 25 | 89 |
| 2300 47th AVE | Oakland | 1937 | 2 | 2 | 1,270 | 5,548 | $511 | $649,000 | 10 | 86 |
| 3042 Eastman Ave | Oakland | 1920 | 3 | 1 | 816 | 4,250 | $734 | $599,000 | 26 | 83 |
| Total: 5 · Average | 2.2 | 1.4 | 1,097 | 4,193.6 | $595.8 | $641,199.8 | 41.2 | |||
| Median | 1,173 | $649,000 | ||||||||
Closed Properties (5)
Closed Comparables
| Address | City | Year | Date | BD | BTH | SqFt | LotSz | LP | SP | SP/SqFt | SP/LP | DIM | Score |
|---|---|---|---|---|---|---|---|---|---|---|---|---|---|
| 4220 Suter St | Oakland | 1921 | 08/10/2026 | 2 | 1 | 994 | 3,430 | $497,000 | $650,000 | $654 | 1.31 | 45 | 88 |
| 4411 Brookdale Ave | Oakland | 1914 | 09/21/2026 | 2 | 1 | 966 | 3,710 | $650,000 | $642,000 | $665 | 0.99 | 59 | 88 |
| 3773 Marion Ave | Oakland | 1913 | 08/03/2026 | 3 | 1 | 1,283 | 4,600 | $599,000 | $610,000 | $475 | 1.02 | 28 | 87 |
| 2701 Octavia ST | Oakland | 1926 | 08/14/2026 | 3 | 1 | 1,214 | 6,300 | $549,000 | $650,000 | $535 | 1.18 | 24 | 85 |
| 3735 Nevil St | Oakland | 1911 | 08/14/2026 | 3 | 1 | 1,045 | 3,750 | $625,000 | $625,000 | $598 | 1.00 | 91 | 85 |
| Total: 5 · Average | 2.6 | 1.0 | 1,100.4 | 4,358 | $635,400 | $635,400 | $585.4 | — | 49.4 | ||||
| Median | 1,045 | $642,000 | $642,000 | ||||||||||
Market Analysis
List vs Sale $/SqFt
Sale Price Trend
Days on Market
Sale vs List Price
This analysis was generated automatically from MLS data. For an in-depth, human-reviewed valuation, contact Joseph Sardella at josephsardella@gmail.com.