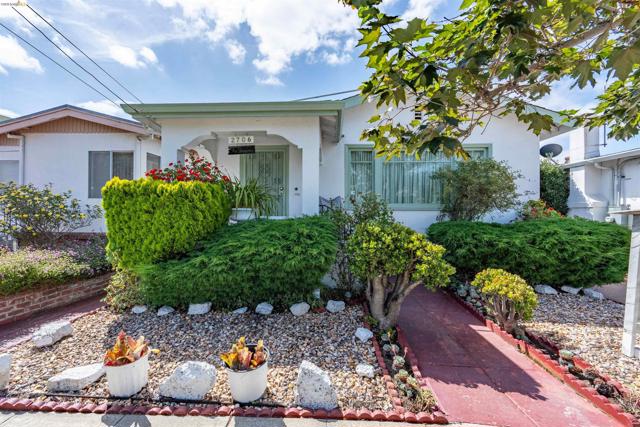
1 / 5
2706 67Th Ave, Oakland, CA 94605
$699K2bd · 1ba · 1,236 sqft
Lot 3,800 sqft•Single Family Residence•Active•142d on market•MLS# 00-41140014
2706 67Th Ave, Oakland, CA 94605
MLS# 00-41140014•Residential•Single Family Residence
Active142 days on market
$699,000
2
Beds
1
Baths
1,236
Sq Ft
3,800
Lot Sq Ft
1923
Year Built
Property Description
Great location! Large yard! Great floor plan.... this is THE ONE! This qauint home boasts a new roof freshly painted interior and exterior. Has a separate unit in the rear that could be a perfect home office, shop, etc. Overall prime location near freeway, restaurants and schools. LARGE BACKYARD. iN EXCELLENT CONDITION. This one is a real find!
Features & Amenities
FeeBuilt 1923
Property Details
Land Type
Fee
Year Built
1923
Property Type
Residential
Property Subtype
Single Family Residence
Heating
Wall Furnace
Flooring
Carpet, Laminate
City
Oakland
Zip Code
94605
County
Alameda
Mortgage Calculator
Current Rates
$
$
%
Monthly Payment
$3,534.52
Principal & Interest
Loan Amount
$559,200
Total Interest
$713,229
Total Payment Over 30 Years
$1,272,429
This calculator provides estimates only. Actual mortgage payments may include taxes, insurance, HOA fees, and PMI. Contact a lender for accurate quotes.
Comparative Market Analysis
Affordable Tier · 5 active · 5 closed
2706 67Th Ave, Oakland, CA 94605
Oakland · Single Family Residence
$699K
Affordable TierBeds
2
Baths
1
Sqft
1,236
Lot
3,800 sqft
Year
1923
$/Sqft
$566
Pool: No✓
Listed 7.1% above the median closed sale of $652,500. Closed comps sold at 107% of list — strong seller's market.
Price Position
Positioned above the market — commands a premium.
Premium
Subject listed at $699K· $566/sqft
Total list price
Closed comps
vs closed median $653K
+$47K (+7.1%)
Active comps
vs active median $650K
+$49K (+7.5%)
Price per sqft
Closed compsinsufficient comp data
Active comps
vs active avg $/sqft $412
+$154 (+37.2%)
Active Properties (5)
Active Comparables
| Address | City | Year | BD | BTH | SqFt | LotSz | LP/SqFt | LP | DIM | Score |
|---|---|---|---|---|---|---|---|---|---|---|
| 5421 Brann St | Oakland | 1928 | 3 | 1 | 1,358 | 4,000 | $479 | $650,000 | 57 | 85 |
| 2914 75th Ave | Oakland | 1931 | 3 | 2 | 1,758 | 3,800 | $341 | $599,000 | 10 | 74 |
| 6440 Sunnymere | Oakland | 1926 | 4 | 3 | 1,575 | 5,280 | $435 | $685,000 | 30 | 68 |
| 6138 Oakdale | Oakland | 1956 | 3 | 2 | 1,616 | 8,569 | $459 | $742,500 | 73 | 63 |
| 2401 80th AVE | Oakland | 1939 | 4 | 3 | 1,866 | 3,850 | $348 | $650,000 | 104 | 60 |
| Total: 5 · Average | 3.4 | 2.2 | 1,634.6 | 5,099.8 | $412.4 | $665,300 | 54.8 | |||
| Median | 1,616 | $650,000 | ||||||||
Closed Properties (5)
Closed Comparables
| Address | City | Year | Date | BD | BTH | SqFt | LotSz | LP | SP | SP/SqFt | SP/LP | DIM | Score |
|---|---|---|---|---|---|---|---|---|---|---|---|---|---|
| 2512 67th Ave | Oakland | 1924 | 02/03/2026 | 2 | 1 | 1,236 | 3,800 | $549,000 | $600,000 | $485 | 1.09 | 26 | 90 |
| 2724 Seminary Ave | Oakland | 1918 | 08/21/2026 | 3 | 1 | 1,342 | 4,400 | $689,000 | $775,000 | $577 | 1.13 | 64 | 86 |
| 3440 68Th Ave | Oakland | 1920 | 10/05/2026 | 3 | 2 | 1,246 | 5,282 | $639,000 | $660,000 | $530 | 1.03 | 65 | 84 |
| 2427 67Th Ave | Oakland | 1924 | 06/05/2026 | 3 | 2 | 1,134 | 3,500 | $619,000 | $652,500 | $575 | 1.05 | 37 | 84 |
| 3144 60Th Ave | Oakland | 1925 | 12/18/2025 | 2 | 1 | 1,054 | 4,180 | $629,000 | $646,750 | $614 | 1.03 | 105 | 82 |
| Total: 5 · Average | 2.6 | 1.4 | 1,202.4 | 4,232.4 | $666,850 | $666,850 | $556.2 | — | 59.4 | ||||
| Median | 1,236 | $652,500 | $652,500 | ||||||||||
Market Analysis
List vs Sale $/SqFt
Sale Price Trend
Days on Market
Sale vs List Price
AI-generated CMA
This analysis was generated automatically from MLS data. For an in-depth, human-reviewed valuation, contact Joseph Sardella at josephsardella@gmail.com.