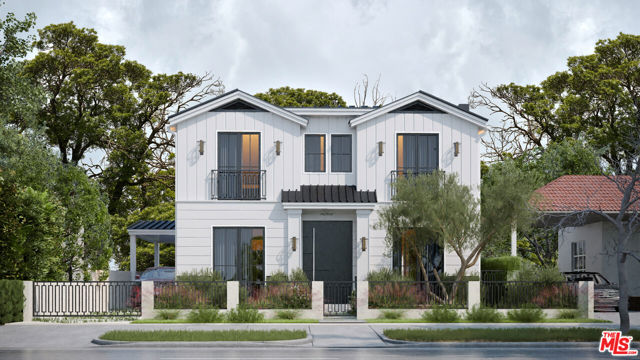
1 / 26
261 South Linden Drive, Beverly Hills, CA 90212
$3.00M0bd · 0ba · 6,000 sqft
Lot 6,373 sqft•Single Family Residence•Active•1135d on market•MLS# 00-23319945
261 South Linden Drive, Beverly Hills, CA 90212
MLS# 00-23319945•Residential•Single Family Residence
Active1135 days on market
$2,999,000
0
Beds
0
Baths
6,000
Sq Ft
6,373
Lot Sq Ft
Property Description
This property has been re-listed and classified as LAND. There is no structure on the lot.
Features & Amenities
Fee
Property Details
Land Type
Fee
Property Type
Residential
Property Subtype
Single Family Residence
City
Beverly Hills
Zip Code
90212
County
Los Angeles
Mortgage Calculator
Current Rates
$
$
%
Monthly Payment
$15,164.58
Principal & Interest
Loan Amount
$2,399,200
Total Interest
$3,060,047
Total Payment Over 30 Years
$5,459,247
This calculator provides estimates only. Actual mortgage payments may include taxes, insurance, HOA fees, and PMI. Contact a lender for accurate quotes.
Comparative Market Analysis
Luxury Tier · 5 active · 5 closed
261 South Linden Drive, Beverly Hills, CA 90212
Beverly Hills · Single Family Residence
$3.00M
Luxury TierBeds
0
Baths
0
Sqft
6,000
Lot
6,373 sqft
Year
0
$/Sqft
$500
Pool: No✓
Spa: No✓
Listed in line with the median closed sale of $3,000,000. Price per sqft ($500) is a 58% discount to closed comps ($1,191). Closed comps sold at 95% of list — buyers have negotiating leverage. Luxury tier — fewer comparable sales widen the confidence range.
Price Position
Aligned with the market — fair pricing for the comps.
At market
Subject listed at $3.00M· $500/sqft
Total list price
Closed comps
vs closed median $3.00M
−$1K (−0.0%)
Active comps
vs active median $3.00M
−$1K (−0.0%)
Price per sqft
Closed compsinsufficient comp data
Active comps
vs active avg $/sqft $1,188
−$688 (−57.9%)
Active Properties (5)
Active Comparables
| Address | City | Year | BD | BTH | SqFt | LotSz | LP/SqFt | LP | DIM | Score |
|---|---|---|---|---|---|---|---|---|---|---|
| 2257 Manning Avenue | Los Angeles | 2009 | 3 | 5 | 4,443 | 6,075 | $674 | $3.00M | 135 | 73 |
| 10388 Keswick Avenue | Los Angeles | 1932 | 4 | 4 | 3,130 | 6,253 | $1,021 | $3.19M | 31 | 68 |
| 10308 Keswick Avenue | Los Angeles | 1940 | 4 | 4 | 1,807 | 5,626 | $1,522 | $2.75M | 87 | 63 |
| 1470 Doheny Drive | Los Angeles | 1947 | 3 | 3 | 2,150 | 5,724 | $1,395 | $3.00M | 59 | 61 |
| 442 Wetherly Drive | Beverly Hills | 1930 | 4 | 5 | 2,400 | 4,950 | $1,329 | $3.19M | 175 | 59 |
| Total: 5 · Average | 3.6 | 4.2 | 2,786 | 5,725.6 | $1,188.2 | $3.03M | 97.4 | |||
| Median | 2,400 | $3.00M | ||||||||
Closed Properties (5)
Closed Comparables
| Address | City | Year | Date | BD | BTH | SqFt | LotSz | LP | SP | SP/SqFt | SP/LP | DIM | Score |
|---|---|---|---|---|---|---|---|---|---|---|---|---|---|
| 317 Canon Drive | Beverly Hills | 1926 | 07/02/2026 | 3 | 3 | 1,787 | 6,073 | $2.99M | $3.20M | $1,791 | 1.07 | 34 | 73 |
| 1625 Rexford Drive | Los Angeles | 2026 | 09/02/2026 | 5 | 6 | 3,758 | 7,443 | $5.25M | $3.01M | $800 | 0.57 | 461 | 66 |
| 10346 Ilona Avenue | Los Angeles | 1937 | 09/30/2026 | 4 | 4 | 2,407 | 6,523 | $2.50M | $2.81M | $1,166 | 1.12 | 42 | 66 |
| 110 Elm Drive | Beverly Hills | 1930 | 04/30/2026 | 4 | 4 | 2,965 | 7,502 | $3.50M | $3.00M | $1,012 | 0.86 | 21 | 65 |
| 1617 Reeves Street | Los Angeles | 1948 | 05/07/2026 | 3 | 2 | 2,389 | 6,620 | $2.55M | $2.83M | $1,185 | 1.11 | 27 | 63 |
| Total: 5 · Average | 3.8 | 3.8 | 2,661.2 | 6,832.2 | $2.97M | $2.97M | $1,190.8 | — | 117 | ||||
| Median | 2,407 | $3.00M | $3.00M | ||||||||||
Market Analysis
List vs Sale $/SqFt
Sale Price Trend
Days on Market
Sale vs List Price
AI-generated CMA
This analysis was generated automatically from MLS data. For an in-depth, human-reviewed valuation, contact Joseph Sardella at josephsardella@gmail.com.