260 Industrial Pkwy, 38, Hayward, CA 94544
260 Industrial Pkwy, 38, Hayward, CA 94544
Property Description
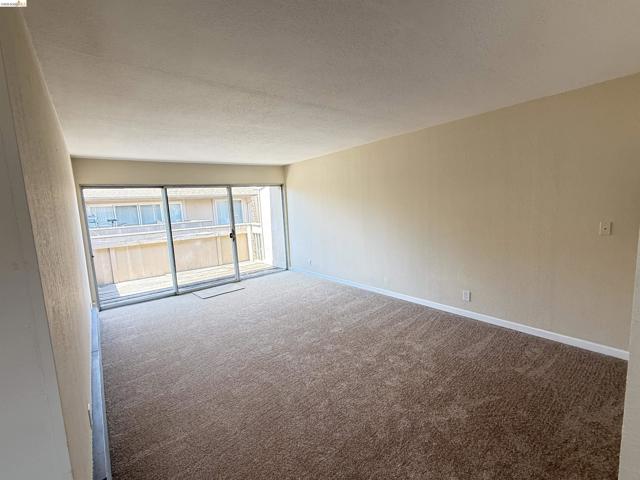
Just Finished Updating: Owner Occupant or Investor Opportunity! Top Floor End Unit Cute 1 bedroom unit with updated galley style kitchen: Quartz Counter tops, Stainless Steel sink with disposal, Dishwasher, Electric Stove. Overlooking living room. Laundry in hallway. Just installed carpeting, Updated bathroom. 1 Car car port. guest parking space. Complex has a Pool. Convenient location Just off Mission Blvd. Close to shopping, Cal State East Bay. Complex is Wyndham Terrace
Features & Amenities
Property Details
Mortgage Calculator
Current Rates
Comparative Market Analysis
Affordable Tier · 2 active · 2 closed
Hayward · Condominium
Listed 10.2% below the median closed sale of $322,500. Price per sqft ($422) is a 25% discount to closed comps ($561). Closed comps sold at 94% of list — buyers have negotiating leverage.
Price Position
Priced below the market — value advantage over the field.
Active Properties (2)
Active Comparables
| Address | City | Year | BD | BTH | SqFt | LotSz | LP/SqFt | LP | DIM | Score |
|---|---|---|---|---|---|---|---|---|---|---|
| 260 Industrial Pkwy | Hayward | 1973 | 1 | 1 | 686 | 60,128 | $436 | $299,000 | 53 | 99 |
| 325 Valle Vista Ave | Hayward | 1984 | 1 | 1 | 598 | 64,567 | $451 | $269,950 | 179 | 86 |
| Total: 2 · Average | 1.0 | 1.0 | 642 | 62,347.5 | $443.5 | $284,475 | 116 | |||
| Median | 686 | $299,000 | ||||||||
Closed Properties (2)
Closed Comparables
| Address | City | Year | Date | BD | BTH | SqFt | LotSz | LP | SP | SP/SqFt | SP/LP | DIM | Score |
|---|---|---|---|---|---|---|---|---|---|---|---|---|---|
| 620 River Oak Way | Hayward | 1985 | 08/10/2026 | 1 | 1 | 546 | 167,131 | $349,000 | $320,000 | $586 | 0.92 | 45 | 81 |
| 26088 Kay Ave | Hayward | 1985 | 06/22/2026 | 1 | 1 | 606 | 75,590 | $338,950 | $325,000 | $536 | 0.96 | 164 | 66 |
| Total: 2 · Average | 1.0 | 1.0 | 576 | 121,360.5 | $322,500 | $322,500 | $561 | — | 104.5 | ||||
| Median | 606 | $325,000 | $325,000 | ||||||||||
Market Analysis
List vs Sale $/SqFt
Sale Price Trend
Days on Market
Sale vs List Price
This analysis was generated automatically from MLS data. For an in-depth, human-reviewed valuation, contact Joseph Sardella at josephsardella@gmail.com.