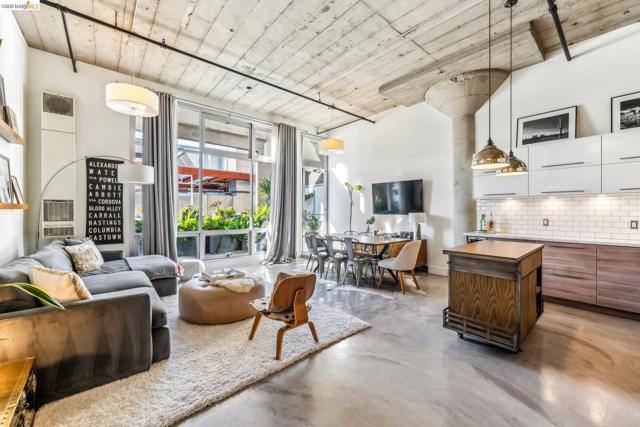
255 3Rd St, 206, Oakland, CA 94607
255 3Rd St, 206, Oakland, CA 94607
Property Description
Spectacular warehouse conversion loft in the heart of Jack London Square with sleek finishes, clever storage options and private outdoor space. In the fashion of a true loft the property offers double height ceilings, mushroom capped columns, library with sliding ladder & a wall of Southwest facing warehouse windows. This inspiring property comes with deeded parking and is located steps to the waterfront, restaurants, transportation and more. Come see what the buzz is all about in Jack London Square.
Features & Amenities
Property Details
Mortgage Calculator
Current Rates
Comparative Market Analysis
Affordable Tier · 5 active · 5 closed
Oakland · Condominium
Listed in line with the median closed sale of $525,000. Closed comps sold at 103% of list — strong seller's market.
Price Position
Aligned with the market — fair pricing for the comps.
Active Properties (5)
Active Comparables
| Address | City | Year | BD | BTH | SqFt | LotSz | LP/SqFt | LP | DIM | Score |
|---|---|---|---|---|---|---|---|---|---|---|
| 675 8th St | Oakland | 2002 | 2 | 2 | 993 | 9,216 | $498 | $495,000 | 58 | 69 |
| 585 9Th St | Oakland | 2008 | 2 | 2 | 990 | 23,942 | $555 | $549,000 | 94 | 68 |
| 260 Brooklyn Basin Way | Oakland | 2023 | 2 | 2 | 954 | 0 | $561 | $534,900 | 88 | 66 |
| 850 Grand Ave | Oakland | 2003 | 1 | 2 | 1,613 | 11,929 | $347 | $559,900 | 80 | 65 |
| 303 Adams St | Oakland | 1971 | 2 | 2 | 1,116 | 20,324 | $461 | $515,000 | 67 | 64 |
| Total: 5 · Average | 1.8 | 2.0 | 1,133.2 | 16,352.75 | $484.4 | $530,760 | 77.4 | |||
| Median | 993 | $534,900 | ||||||||
Closed Properties (5)
Closed Comparables
| Address | City | Year | Date | BD | BTH | SqFt | LotSz | LP | SP | SP/SqFt | SP/LP | DIM | Score |
|---|---|---|---|---|---|---|---|---|---|---|---|---|---|
| 247 4Th St | Oakland | 1923 | 08/12/2026 | 1 | 1 | 1,208 | 15,021 | $449,000 | $525,000 | $435 | 1.17 | 27 | 94 |
| 247 Fourth Street | Oakland | 1923 | 09/08/2026 | 1 | 1 | 1,383 | 15,021 | $549,000 | $535,000 | $387 | 0.97 | 24 | 91 |
| 201 4Th St | Oakland | 1928 | 09/08/2026 | 1 | 1 | 1,036 | 15,035 | $439,000 | $484,000 | $467 | 1.10 | 39 | 90 |
| 311 Oak St | Oakland | 2003 | 10/09/2026 | 2 | 2 | 1,250 | 60,085 | $569,000 | $580,000 | $464 | 1.02 | 66 | 77 |
| 423 7th Street | Oakland | 2008 | 08/28/2026 | 2 | 2 | 1,235 | 32,653 | $499,000 | $450,000 | $364 | 0.90 | 75 | 75 |
| Total: 5 · Average | 1.4 | 1.4 | 1,222.4 | 27,563 | $514,800 | $514,800 | $423.4 | — | 46.2 | ||||
| Median | 1,235 | $525,000 | $525,000 | ||||||||||
Market Analysis
List vs Sale $/SqFt
Sale Price Trend
Days on Market
Sale vs List Price
This analysis was generated automatically from MLS data. For an in-depth, human-reviewed valuation, contact Joseph Sardella at josephsardella@gmail.com.