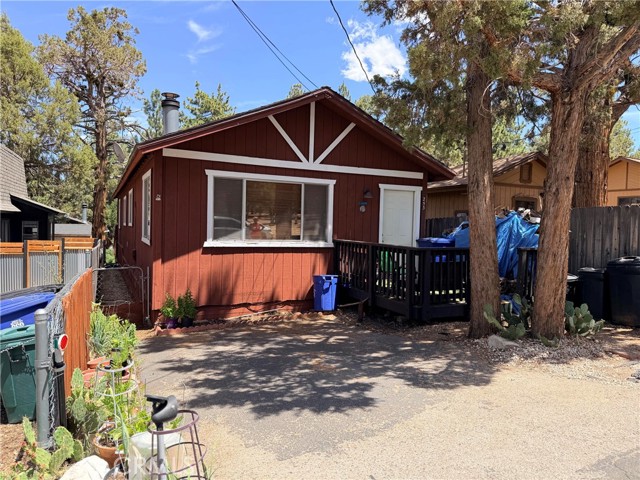
253 Santa Barbara, CA 92386
253 Santa Barbara, CA 92386
Property Description
Welcome to this charming retreat nestled in the heart of Sugarloaf. At 1,140 square feet, this residence offers a warm and inviting atmosphere that makes you feel at home the moment you step through the door. The layout features three well-appointed bedrooms and two bathrooms, providing a comfortable and functional flow throughout the space. This property is a fixer that needs some TLC, including new flooring and painting, offering a fantastic canvas for your personal touch and creative vision. Listed at $285,000, this home presents a wonderful opportunity to own a piece of the mountains. Whether you're looking for a full-time residence or a seasonal getaway, the character and potential of this home are sure to impress. Don't miss your chance to see everything 253 Santa Barbara Ave has to offer in this beautiful California setting.
Features & Amenities
Property Details
Mortgage Calculator
Current Rates
Comparative Market Analysis
Affordable Tier · 5 active · 5 closed
· Single Family Residence
Listed 8.1% below the median closed sale of $310,000. Price per sqft ($250) is a 19% discount to closed comps ($308).
Price Position
Priced below the market — value advantage over the field.
Active Properties (5)
Active Comparables
| Address | City | Year | BD | BTH | SqFt | LotSz | LP/SqFt | LP | DIM | Score |
|---|---|---|---|---|---|---|---|---|---|---|
| 272 Imperial Avenue | 1983 | 2 | 2 | 1,274 | 2,500 | $235 | $299,000 | 58 | 90 | |
| 459 Inyo Avenue | Sugarloaf | 1979 | 2 | 1 | 840 | 2,500 | $387 | $325,000 | 93 | 81 |
| 124 Wabash | 1978 | 2 | 1 | 760 | 2,500 | $328 | $249,000 | 142 | 81 | |
| 594 Los Angeles Avenue | 1978 | 2 | 1 | 836 | 2,500 | $321 | $267,998 | 240 | 80 | |
| 346 San Bernardino Avenue | 1978 | 2 | 1 | 608 | 2,500 | $469 | $285,000 | 296 | 77 | |
| Total: 5 · Average | 2.0 | 1.2 | 863.6 | 2,500 | $348 | $285,199.6 | 165.8 | |||
| Median | 836 | $285,000 | ||||||||
Closed Properties (5)
Closed Comparables
| Address | City | Year | Date | BD | BTH | SqFt | LotSz | LP | SP | SP/SqFt | SP/LP | DIM | Score |
|---|---|---|---|---|---|---|---|---|---|---|---|---|---|
| 418 Sunset Lane | 1970 | 10/02/2026 | 3 | 2 | 1,183 | 7,500 | $324,900 | $310,000 | $262 | 0.95 | 50 | 89 | |
| 396 Riverside Avenue | Sugarloaf | 1980 | 09/03/2026 | 3 | 2 | 1,056 | 4,750 | $299,000 | $315,000 | $298 | 1.05 | 78 | 88 |
| 396 Kern Avenue | 1977 | 10/02/2026 | 2 | 1 | 720 | 2,500 | $299,999 | $290,000 | $403 | 0.97 | 30 | 83 | |
| 525 Kern | 1973 | 07/09/2026 | 2 | 1 | 1,100 | 5,000 | $305,000 | $298,000 | $271 | 0.98 | 62 | 83 | |
| 172 Vista | 1981 | 04/15/2026 | 2 | 2 | 1,024 | 4,750 | $329,000 | $313,700 | $306 | 0.95 | 145 | 82 | |
| Total: 5 · Average | 2.4 | 1.6 | 1,016.6 | 4,900 | $305,340 | $305,340 | $308 | — | 73 | ||||
| Median | 1,056 | $310,000 | $310,000 | ||||||||||
Market Analysis
List vs Sale $/SqFt
Sale Price Trend
Days on Market
Sale vs List Price
This analysis was generated automatically from MLS data. For an in-depth, human-reviewed valuation, contact Joseph Sardella at josephsardella@gmail.com.