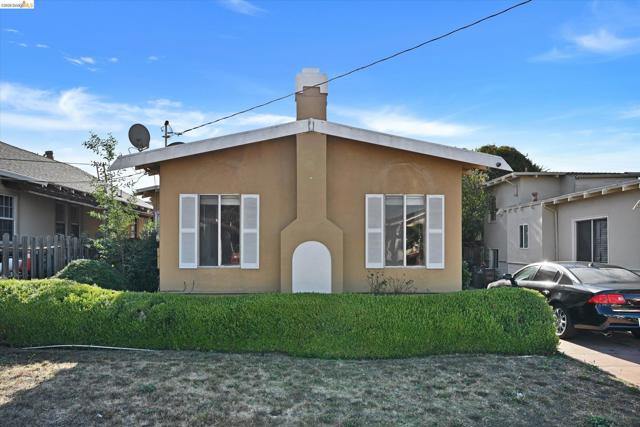
2524 66Th Ave, Oakland, CA 94605
2524 66Th Ave, Oakland, CA 94605
Property Description
Welcome to this move-in ready 2-bedroom, 1-bath home offering ~1,204 square feet of living space in Oakland’s Havenscourt neighborhood. Recently updated interiors feature new laminate flooring, a remodeled kitchen and bathroom, and refreshed living spaces that create an inviting setting. A comfortable yet spacious layout with a fresh, updated feel you can personalize to your own. Enjoy convenient access to Eastmont Town Center, shopping and dining along Bancroft Avenue, nearby parks and schools, as well as I-580, I-880, public transportation, and Oakland International Airport.
Features & Amenities
Property Details
Mortgage Calculator
Current Rates
Comparative Market Analysis
Affordable Tier · 5 active · 5 closed
Oakland · Single Family Residence
Listed in line with the median closed sale of $536,500. Closed comps sold at 107% of list — strong seller's market.
Price Position
Aligned with the market — fair pricing for the comps.
Active Properties (5)
Active Comparables
| Address | City | Year | BD | BTH | SqFt | LotSz | LP/SqFt | LP | DIM | Score |
|---|---|---|---|---|---|---|---|---|---|---|
| 1614 72Nd Ave | Oakland | 1923 | 2 | 1 | 1,020 | 3,960 | $475 | $485,000 | 37 | 89 |
| 1643 68th Ave. | Oakland | 1924 | 3 | 1 | 1,363 | 3,800 | $367 | $500,000 | 42 | 88 |
| 2474 Seminary Ave | Oakland | 1921 | 3 | 2 | 1,018 | 4,400 | $560 | $570,000 | 82 | 85 |
| 8021 Hillside St | Oakland | 1925 | 2 | 1 | 973 | 3,420 | $544 | $529,000 | 6 | 84 |
| 7650 Ney Ave | Oakland | 1929 | 3 | 1 | 1,267 | 3,300 | $446 | $565,000 | 31 | 83 |
| Total: 5 · Average | 2.6 | 1.2 | 1,128.2 | 3,776 | $478.4 | $529,800 | 39.6 | |||
| Median | 1,020 | $529,000 | ||||||||
Closed Properties (5)
Closed Comparables
| Address | City | Year | Date | BD | BTH | SqFt | LotSz | LP | SP | SP/SqFt | SP/LP | DIM | Score |
|---|---|---|---|---|---|---|---|---|---|---|---|---|---|
| 2621 66th Avenue | Oakland | 1925 | 09/03/2026 | 2 | 1 | 1,056 | 3,963 | $550,000 | $510,000 | $483 | 0.93 | 293 | 93 |
| 2115 Havenscourt Blvd | Oakland | 1925 | 09/17/2026 | 2 | 1 | 1,044 | 3,570 | $499,000 | $550,000 | $527 | 1.10 | 65 | 92 |
| 2134 62Nd Ave G | Oakland | 1925 | 11/04/2026 | 2 | 1 | 1,079 | 3,810 | $487,000 | $536,500 | $497 | 1.10 | 69 | 91 |
| 2512 67th Ave | Oakland | 1924 | 02/03/2026 | 2 | 1 | 1,236 | 3,800 | $549,000 | $600,000 | $485 | 1.09 | 26 | 90 |
| 1918 62Nd Ave | Oakland | 1923 | 10/20/2026 | 2 | 1 | 963 | 5,000 | $459,000 | $520,000 | $540 | 1.13 | 41 | 87 |
| Total: 5 · Average | 2.0 | 1.0 | 1,075.6 | 4,028.6 | $543,300 | $543,300 | $506.4 | — | 98.8 | ||||
| Median | 1,056 | $536,500 | $536,500 | ||||||||||
Market Analysis
List vs Sale $/SqFt
Sale Price Trend
Days on Market
Sale vs List Price
This analysis was generated automatically from MLS data. For an in-depth, human-reviewed valuation, contact Joseph Sardella at josephsardella@gmail.com.