1 / 23
25129 Copa Del Oro Dr, 203, Hayward, CA 94545
$379K1bd · 1ba · 608 sqft
Lot 256,074 sqft•HOA $406/mo•Condominium•Active•43d on market•MLS# 00-41150409
25129 Copa Del Oro Dr, 203, Hayward, CA 94545
MLS# 00-41150409•Residential•Condominium
Active43 days on market
$379,000
1
Beds
1
Baths
608
Sq Ft
256,074
Lot Sq Ft
$406
HOA/mo
1991
Year Built
Pool
View
Property Description
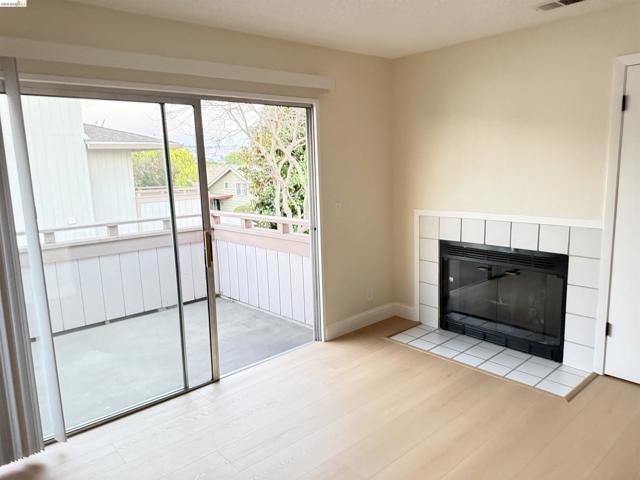
Imaging living close to Hesperian Blvd near shopping center, community college, San Mateo Bridge, downtown Hayward. This upper floor unit is equipped with a fire place, balcony, updated kitchen new flooring, lighting, in unit laundry hook-ups and is move in ready.
Features & Amenities
FeeBuilt 1991
Property Details
Land Type
Fee
Year Built
1991
Property Type
Residential
Property Subtype
Condominium
View
Pool
Flooring
Carpet, Laminate
City
Hayward
Zip Code
94545
County
Alameda
Mortgage Calculator
Current Rates
$
$
%
Monthly Payment
$1,916.43
Principal & Interest
Loan Amount
$303,200
Total Interest
$386,715
Total Payment Over 30 Years
$689,915
This calculator provides estimates only. Actual mortgage payments may include taxes, insurance, HOA fees, and PMI. Contact a lender for accurate quotes.
Comparative Market Analysis
Affordable Tier · 2 active · 5 closed
25129 Copa Del Oro Dr, 203, Hayward, CA 94545
Hayward · Condominium
$379K
Affordable TierBeds
1
Baths
1
Sqft
608
Lot
5.88 ac
Year
1991
$/Sqft
$623
Pool: Yes✓
View: Pool✓
Listed in line with the median closed sale of $386,000. Price per sqft ($623) is a 34% premium to closed comps ($465). Closed comps sold at 103% of list — strong seller's market.
Price Position
Aligned with the market — fair pricing for the comps.
At market
Subject listed at $379K· $623/sqft
Total list price
Closed comps
vs closed median $386K
−$7K (−1.8%)
Active comps
vs active median $425K
−$46K (−10.8%)
Price per sqft
Closed compsinsufficient comp data
Active comps
vs active avg $/sqft $380
+$243 (+63.9%)
Active Properties (2)
Active Comparables
| Address | City | Year | BD | BTH | SqFt | LotSz | LP/SqFt | LP | DIM | Score |
|---|---|---|---|---|---|---|---|---|---|---|
| 722 Kino Ct | Hayward | 1982 | 2 | 2 | 1,070 | 34,720 | $374 | $399,888 | 114 | 48 |
| 21314 Gary Dr | Hayward | 1991 | 2 | 2 | 1,100 | 103,237 | $386 | $425,000 | 51 | 44 |
| Total: 2 · Average | 2.0 | 2.0 | 1,085 | 68,978.5 | $380 | $412,444 | 82.5 | |||
| Median | 1,100 | $425,000 | ||||||||
Closed Properties (5)
Closed Comparables
| Address | City | Year | Date | BD | BTH | SqFt | LotSz | LP | SP | SP/SqFt | SP/LP | DIM | Score |
|---|---|---|---|---|---|---|---|---|---|---|---|---|---|
| 26088 Kay Ave | Hayward | 1985 | 06/22/2026 | 1 | 1 | 606 | 75,590 | $338,950 | $325,000 | $536 | 0.96 | 164 | 87 |
| 26088 Kay Ave | Hayward | 1985 | 05/26/2026 | 2 | 1 | 795 | 75,590 | $368,000 | $370,000 | $465 | 1.00 | 46 | 77 |
| 25938 Kay Ave | Hayward | 1989 | 04/20/2026 | 1 | 1 | 840 | 86,553 | $349,000 | $420,000 | $500 | 1.20 | 68 | 76 |
| 25930 Kay Ave | Hayward | 1982 | 09/14/2026 | 1 | 2 | 982 | 90,200 | $390,000 | $386,000 | $393 | 0.99 | 47 | 70 |
| 25850 Kay Ave | Hayward | 1989 | 08/21/2026 | 2 | 2 | 1,007 | 143,134 | $439,000 | $435,000 | $432 | 0.99 | 42 | 69 |
| Total: 5 · Average | 1.4 | 1.4 | 846 | 94,213.4 | $387,200 | $387,200 | $465.2 | — | 73.4 | ||||
| Median | 840 | $386,000 | $386,000 | ||||||||||
Market Analysis
List vs Sale $/SqFt
Sale Price Trend
Days on Market
Sale vs List Price
AI-generated CMA
This analysis was generated automatically from MLS data. For an in-depth, human-reviewed valuation, contact Joseph Sardella at josephsardella@gmail.com.