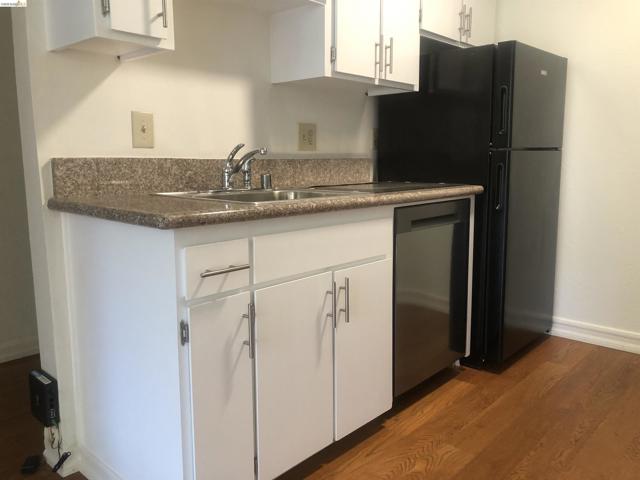
250 Whitmore St, 302, Oakland, CA 94611
250 Whitmore St, 302, Oakland, CA 94611
Property Description
Sunny and quiet on the third floor. Revel in upgraded stone counters and hard floors. Work out in gym or long pool heated year round, then unwind in dry redwood sauna or jacuzzi under stars. Walk score 95. No rent restrictions. Open house on Saturday, October 10 from 10:00am to 3:00pm. Open house on Sunday, October 11 from 10:00am to 1:00pm.
Features & Amenities
Property Details
Mortgage Calculator
Current Rates
Comparative Market Analysis
Affordable Tier · 5 active · 5 closed
Oakland · Condominium
Listed 3.2% above the median closed sale of $315,000. Price per sqft ($555) is a 20% premium to closed comps ($463). Closed comps sold at 102% of list — strong seller's market.
Price Position
Aligned with the market — fair pricing for the comps.
Active Properties (5)
Active Comparables
| Address | City | Year | BD | BTH | SqFt | LotSz | LP/SqFt | LP | DIM | Score |
|---|---|---|---|---|---|---|---|---|---|---|
| 2005 Pleasant Valley | Oakland | 1975 | 1 | 1 | 650 | 21,215 | $528 | $343,000 | 51 | 91 |
| 567 Oakland Avenue | Oakland | 1970 | 1 | 1 | 741 | 22,133 | $398 | $295,000 | 46 | 82 |
| 651 Oakland Ave | Oakland | 1967 | 1 | 1 | 597 | 9,370 | $477 | $285,000 | 122 | 81 |
| 127 Bayo Vista Ave | Oakland | 1972 | 2 | 1 | 1,113 | 11,992 | $328 | $365,000 | 66 | 62 |
| 200 Caldecott Ln | Oakland | 1996 | 1 | 1 | 773 | 26,340 | $446 | $345,000 | 88 | 62 |
| Total: 5 · Average | 1.2 | 1.0 | 774.8 | 18,210 | $435.4 | $326,600 | 74.6 | |||
| Median | 741 | $343,000 | ||||||||
Closed Properties (5)
Closed Comparables
| Address | City | Year | Date | BD | BTH | SqFt | LotSz | LP | SP | SP/SqFt | SP/LP | DIM | Score |
|---|---|---|---|---|---|---|---|---|---|---|---|---|---|
| 250 Whitmore St | Oakland | 1971 | 08/21/2026 | 1 | 1 | 640 | 23,006 | $285,000 | $280,000 | $438 | 0.98 | 38 | 90 |
| 2005 Pleasant Valley Ave | Oakland | 1975 | 08/25/2026 | 1 | 1 | 680 | 21,215 | $329,000 | $320,000 | $471 | 0.97 | 66 | 87 |
| 288 Whitmore St | Oakland | 1976 | 09/29/2026 | 1 | 1 | 695 | 33,944 | $299,000 | $310,000 | $446 | 1.04 | 84 | 87 |
| 250 Whitmore St | Oakland | 1971 | 05/12/2026 | 1 | 1 | 732 | 23,006 | $299,000 | $315,000 | $430 | 1.05 | 64 | 85 |
| 3751 Harrison Street | Oakland | 1972 | 07/29/2026 | 1 | 1 | 641 | 5,625 | $328,000 | $340,000 | $530 | 1.04 | 70 | 79 |
| Total: 5 · Average | 1.0 | 1.0 | 677.6 | 21,359.2 | $313,000 | $313,000 | $463 | — | 64.4 | ||||
| Median | 680 | $315,000 | $315,000 | ||||||||||
Market Analysis
List vs Sale $/SqFt
Sale Price Trend
Days on Market
Sale vs List Price
This analysis was generated automatically from MLS data. For an in-depth, human-reviewed valuation, contact Joseph Sardella at josephsardella@gmail.com.