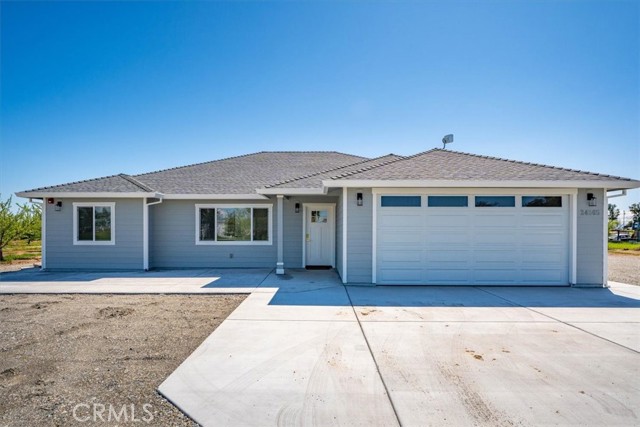
24565 Foster Road, Corning, CA 96021
24565 Foster Road, Corning, CA 96021
Property Description
Welcome to this 2025-built 3 bedroom, 2 bathroom home featuring a desirable split floor plan and modern finishes throughout. The spacious kitchen boasts sleek quartz countertops, soft-close cabinetry, and stainless steel appliances—perfect for entertaining or everyday living. Durable vinyl plank flooring flows through the home, combining style with functionality. Enjoy outdoor living on the large covered patio, ideal for relaxing evenings or weekend gatherings. The property includes an almond orchard and is supported by an agricultural well, offering great potential for hobby farming or income production. A two-car attached garage adds convenience to this peaceful country setting. Don’t miss your chance to own this turn-key property with acreage and charm!
Features & Amenities
Property Details
Mortgage Calculator
Current Rates
Comparative Market Analysis
Affordable Tier · 1 active · 3 closed
Corning · Single Family Residence
Listed 7.0% below the median closed sale of $640,000. Price per sqft ($496) is a 55% premium to closed comps ($320). Expect a longer timeline — comps averaged 164 days on market.
Price Position
Priced below the market — value advantage over the field.
Active Properties (1)
Active Comparables
| Address | City | Year | BD | BTH | SqFt | LotSz | LP/SqFt | LP | DIM | Score |
|---|---|---|---|---|---|---|---|---|---|---|
| 3325 Hall | Corning | 1983 | 3 | 2 | 1,764 | 670,824 | $349 | $615,000 | 108 | 54 |
| Total: 1 · Average | 3.0 | 2.0 | 1,764 | 670,824 | $349 | $615,000 | 108 | |||
| Median | 1,764 | $615,000 | ||||||||
Closed Properties (3)
Closed Comparables
| Address | City | Year | Date | BD | BTH | SqFt | LotSz | LP | SP | SP/SqFt | SP/LP | DIM | Score |
|---|---|---|---|---|---|---|---|---|---|---|---|---|---|
| 24235 Moon | Corning | 1996 | 05/04/2026 | 3 | 2 | 1,894 | 365,904 | $595,000 | $580,000 | $306 | 0.97 | 216 | 62 |
| 24245 River | Corning | 2006 | 01/30/2026 | 3 | 3 | 1,860 | 467,399 | $675,000 | $660,000 | $355 | 0.98 | 80 | 45 |
| 25050 MASSACHUSSETTS | Corning | 1992 | 04/21/2026 | 4 | 3 | 2,150 | 95,832 | $669,000 | $640,000 | $298 | 0.96 | 196 | 37 |
| Total: 3 · Average | 3.3 | 2.7 | 1,968 | 309,711.667 | $626,666.667 | $626,666.667 | $319.667 | — | 164 | ||||
| Median | 1,894 | $640,000 | $640,000 | ||||||||||
Market Analysis
List vs Sale $/SqFt
Sale Price Trend
Days on Market
Sale vs List Price
This analysis was generated automatically from MLS data. For an in-depth, human-reviewed valuation, contact Joseph Sardella at josephsardella@gmail.com.