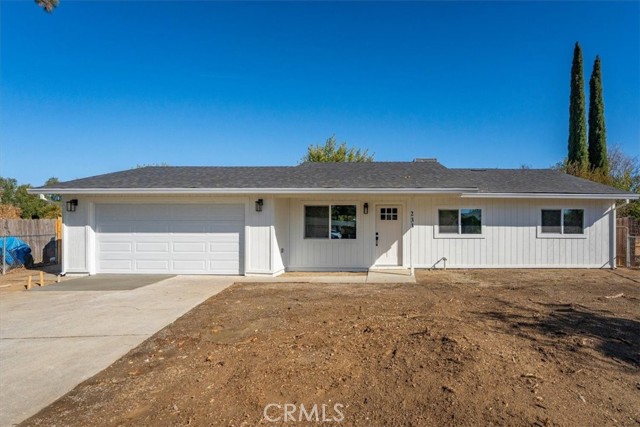
233 Rio Verde Court, Corning, CA 96021
233 Rio Verde Court, Corning, CA 96021
Property Description
Updated 3 bedroom, 2 bath home offering 1,080 sq. ft. of comfortable living space. Recent improvements include an updated kitchen with stainless steel appliances, updated bathrooms with quartz surrounds, new flooring throughout, fresh interior and exterior paint, new lighting fixtures, a new roof, new HVAC system, and a new garage door with opener. Thoughtfully updated from top to bottom, this home blends modern finishes with everyday functionality and is ready to be enjoyed for years to come.
Features & Amenities
Property Details
Mortgage Calculator
Current Rates
Comparative Market Analysis
Affordable Tier · 5 active · 5 closed
Corning · Single Family Residence
Listed 7.4% above the median closed sale of $326,000. Closed comps sold at 106% of list — strong seller's market.
Price Position
Positioned above the market — commands a premium.
Active Properties (5)
Active Comparables
| Address | City | Year | BD | BTH | SqFt | LotSz | LP/SqFt | LP | DIM | Score |
|---|---|---|---|---|---|---|---|---|---|---|
| 1221 Pear | Corning | 1954 | 3 | 2 | 1,156 | 10,528 | $320 | $370,000 | 81 | 76 |
| 1910 Grant | Corning | 1947 | 4 | 2 | 1,418 | 5,663 | $250 | $355,000 | 45 | 73 |
| 1605 BUTTE | Corning | 1915 | 3 | 3 | 1,544 | 6,534 | $194 | $299,999 | 4 | 72 |
| 693 Fripp | Corning | 2003 | 4 | 2 | 1,350 | 8,712 | $252 | $340,000 | 52 | 68 |
| 217 Carona Ave. | Corning | 1952 | 3 | 2 | 1,342 | 15,682 | $297 | $398,000 | 33 | 66 |
| Total: 5 · Average | 3.4 | 2.2 | 1,362 | 9,423.8 | $262.6 | $352,599.8 | 43 | |||
| Median | 1,350 | $355,000 | ||||||||
Closed Properties (5)
Closed Comparables
| Address | City | Year | Date | BD | BTH | SqFt | LotSz | LP | SP | SP/SqFt | SP/LP | DIM | Score |
|---|---|---|---|---|---|---|---|---|---|---|---|---|---|
| 2168 North | Corning | 1979 | 10/16/2026 | 3 | 2 | 1,080 | 7,067 | $340,000 | $330,000 | $306 | 0.97 | 46 | 99 |
| 2158 Donnovan | Corning | 1977 | 06/12/2026 | 3 | 2 | 1,058 | 7,463 | $310,000 | $326,000 | $308 | 1.05 | 37 | 89 |
| 1980 Colusa Street | Corning | 1960 | 03/03/2026 | 3 | 2 | 1,152 | 10,890 | $336,000 | $326,000 | $283 | 0.97 | 214 | 81 |
| 2059 Blossom | Corning | 2008 | 09/30/2026 | 3 | 2 | 1,213 | 6,098 | $329,999 | $329,999 | $272 | 1.00 | 42 | 81 |
| 1703 Yolo St | Corning | 1959 | 06/22/2026 | 3 | 1 | 910 | 6,000 | $249,000 | $320,000 | $352 | 1.28 | 66 | 75 |
| Total: 5 · Average | 3.0 | 1.8 | 1,082.6 | 7,503.6 | $326,399.8 | $326,399.8 | $304.2 | — | 81 | ||||
| Median | 1,080 | $326,000 | $326,000 | ||||||||||
Market Analysis
List vs Sale $/SqFt
Sale Price Trend
Days on Market
Sale vs List Price
This analysis was generated automatically from MLS data. For an in-depth, human-reviewed valuation, contact Joseph Sardella at josephsardella@gmail.com.