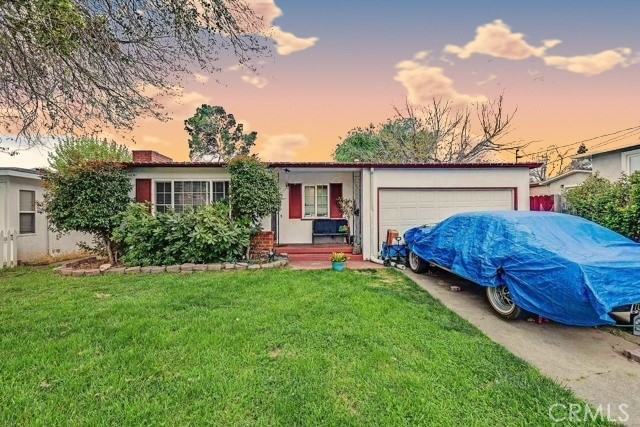
22625 Orion St, Hayward, CA 94541
22625 Orion St, Hayward, CA 94541
Property Description
On market for the first time in OVER HALF A CENTURY and now it's your turn this single story 1952 ranch in Hayward's Fairview neighborhood that offers 3 bedrooms and 1,114 sq ft on a generous 6,600 sq ft lot. A sunny living room centers on a classic fireplace and the spacious yard has room to garden, entertain, or expand. Tucked on a quiet street in a sought after neighborhood, it sits close to restaurants, schools, parks, BART, and downtown Hayward. Bring your vision and make it your own!
Features & Amenities
Property Details
Mortgage Calculator
Current Rates
Comparative Market Analysis
Affordable Tier · 5 active · 5 closed
Hayward · Single Family Residence
Listed 6.7% below the median closed sale of $750,000.
Price Position
Priced below the market — value advantage over the field.
Active Properties (5)
Active Comparables
| Address | City | Year | BD | BTH | SqFt | LotSz | LP/SqFt | LP | DIM | Score |
|---|---|---|---|---|---|---|---|---|---|---|
| 1724 Germaine Ct | Hayward | 1955 | 3 | 2 | 1,194 | 15,725 | $670 | $800,000 | 2 | 80 |
| 2240 Lessley Ave | Castro Valley | 1948 | 3 | 1 | 988 | 5,220 | $810 | $799,888 | 38 | 77 |
| 3292 Kelly St | Hayward | 1916 | 2 | 1 | 1,438 | 5,000 | $522 | $749,999 | 59 | 74 |
| 25132 DEL MAR AVE | Hayward | 1965 | 3 | 2 | 1,081 | 4,400 | $722 | $780,000 | 118 | 74 |
| 18473 Apricot Way | Castro Valley | 1930 | 2 | 1 | 1,079 | 8,238 | $648 | $699,000 | 78 | 68 |
| Total: 5 · Average | 2.6 | 1.4 | 1,156 | 7,716.6 | $674.4 | $765,777.4 | 59 | |||
| Median | 1,081 | $780,000 | ||||||||
Closed Properties (5)
Closed Comparables
| Address | City | Year | Date | BD | BTH | SqFt | LotSz | LP | SP | SP/SqFt | SP/LP | DIM | Score |
|---|---|---|---|---|---|---|---|---|---|---|---|---|---|
| 2272 Kelly St | Hayward | 1956 | 04/30/2026 | 3 | 2 | 1,109 | 4,803 | $709,000 | $730,000 | $658 | 1.03 | 337 | 89 |
| 1947 E St | Hayward | 1947 | 05/15/2026 | 2 | 1 | 1,100 | 7,242 | $774,900 | $775,000 | $705 | 1.00 | 34 | 81 |
| 1923 E St | Hayward | 1954 | 11/21/2025 | 3 | 1 | 1,048 | 6,500 | $699,950 | $670,000 | $639 | 0.96 | 37 | 80 |
| 1839 Hill Ave | Hayward | 1953 | 07/21/2026 | 2 | 1 | 836 | 4,829 | $750,000 | $750,000 | $897 | 1.00 | 46 | 79 |
| 22446 Ralston Ln | Hayward | 1985 | 04/29/2026 | 3 | 2 | 1,702 | 5,500 | $750,000 | $760,000 | $447 | 1.01 | 45 | 72 |
| Total: 5 · Average | 2.6 | 1.4 | 1,159 | 5,774.8 | $737,000 | $737,000 | $669.2 | — | 99.8 | ||||
| Median | 1,100 | $750,000 | $750,000 | ||||||||||
Market Analysis
List vs Sale $/SqFt
Sale Price Trend
Days on Market
Sale vs List Price
This analysis was generated automatically from MLS data. For an in-depth, human-reviewed valuation, contact Joseph Sardella at josephsardella@gmail.com.