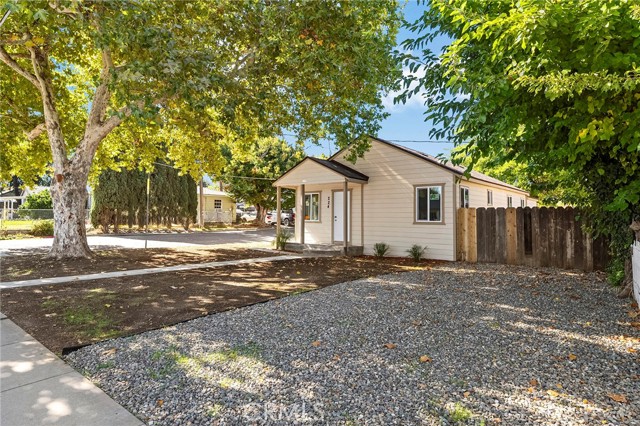
224 S Jackson st, Red Bluff, CA 96080
224 S Jackson st, Red Bluff, CA 96080
Property Description
SELLER FINANCING AVAILABLE!!!! Fully remodeled 3-bedroom, 1-bath home in Red Bluff, CA, showcasing quality upgrades throughout. This move-in ready property features a complete renovation including a new roof, updated electrical, new flooring, and a beautifully redesigned kitchen with modern finishes. The home offers a clean, functional layout with a fresh, contemporary feel, making it ideal for first-time buyers or those seeking a low-maintenance property. A large shop adds exceptional value, providing ample space for storage, hobbies, or workshop use. Conveniently located near local amenities while offering plenty of room for your needs.
Features & Amenities
Property Details
Mortgage Calculator
Current Rates
Comparative Market Analysis
Affordable Tier · 5 active · 5 closed
Red Bluff · Single Family Residence
Listed in line with the median closed sale of $275,000. Price per sqft ($273) is a 25% premium to closed comps ($219). Expect a longer timeline — comps averaged 120 days on market.
Price Position
Aligned with the market — fair pricing for the comps.
Active Properties (5)
Active Comparables
| Address | City | Year | BD | BTH | SqFt | LotSz | LP/SqFt | LP | DIM | Score |
|---|---|---|---|---|---|---|---|---|---|---|
| 1008 Franzel | Red Bluff | 1961 | 3 | 2 | 1,040 | 6,865 | $274 | $285,000 | 80 | 86 |
| 1490 Orange Street | Red Bluff | 1969 | 3 | 2 | 966 | 6,000 | $290 | $279,900 | 80 | 83 |
| 1515 Derby Road | Red Bluff | 1930 | 2 | 1 | 1,672 | 56,628 | $147 | $245,000 | 181 | 58 |
| 330 Belle Mill Road | Red Bluff | 1957 | 4 | 2 | 1,563 | 13,068 | $192 | $300,000 | 124 | 55 |
| 550 Bayles Avenue | Red Bluff | 1916 | 2 | 2 | 1,842 | 47,137 | $157 | $289,900 | 4 | 54 |
| Total: 5 · Average | 2.8 | 1.8 | 1,416.6 | 25,939.6 | $212 | $279,960 | 93.8 | |||
| Median | 1,563 | $285,000 | ||||||||
Closed Properties (5)
Closed Comparables
| Address | City | Year | Date | BD | BTH | SqFt | LotSz | LP | SP | SP/SqFt | SP/LP | DIM | Score |
|---|---|---|---|---|---|---|---|---|---|---|---|---|---|
| 695 Walton Drive | Red Bluff | 1972 | 10/31/2026 | 3 | 2 | 1,056 | 7,841 | $295,000 | $295,000 | $279 | 1.00 | 90 | 79 |
| 1160 Orange Street | Red Bluff | 1961 | 05/11/2026 | 3 | 1 | 1,166 | 81,457 | $249,000 | $245,000 | $210 | 0.98 | 245 | 79 |
| 1720 Luning Street | Red Bluff | 1954 | 05/20/2026 | 3 | 1 | 1,366 | 6,098 | $265,000 | $275,000 | $201 | 1.04 | 49 | 72 |
| 855 Johnson | Red Bluff | 1925 | 10/30/2026 | 4 | 2 | 1,566 | 7,060 | $250,000 | $240,000 | $153 | 0.96 | 183 | 71 |
| 1525 Franzel Road | Red Bluff | 1981 | 12/24/2025 | 3 | 2 | 1,193 | 6,004 | $299,000 | $299,000 | $251 | 1.00 | 33 | 69 |
| Total: 5 · Average | 3.2 | 1.6 | 1,269.4 | 21,692 | $270,800 | $270,800 | $218.8 | — | 120 | ||||
| Median | 1,193 | $275,000 | $275,000 | ||||||||||
Market Analysis
List vs Sale $/SqFt
Sale Price Trend
Days on Market
Sale vs List Price
This analysis was generated automatically from MLS data. For an in-depth, human-reviewed valuation, contact Joseph Sardella at josephsardella@gmail.com.