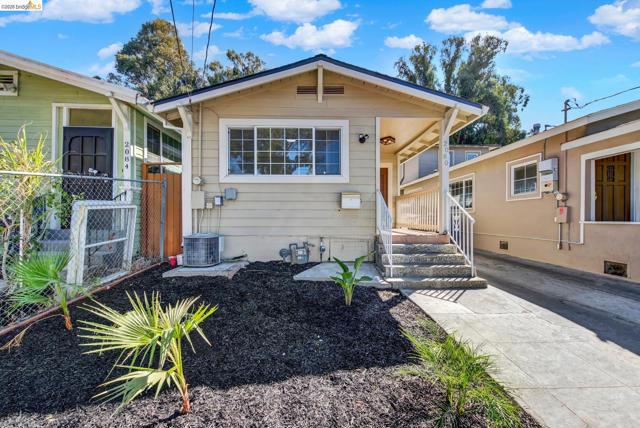
2080 Harrington Ave, Oakland, CA 94601
2080 Harrington Ave, Oakland, CA 94601
Property Description
This is a great opportunity to own this 2 story. home. Just updated kitchen and includes New counter tops, stove, dishwasher microwave oven. Open Kitchen/dining area. Main floor consists of spacious living room, Kitchen/dining room. full bathroom, stairs up, bedroom and laundry/utility room with washer/dryer hookups and bedroom in front of living room. Upstairs includes a primary bedroom/bathroom with glass doors to balcony. Rear facing overlooking backyard area which includes parking space detached structure and area behind it for many possible uses.
Features & Amenities
Property Details
Mortgage Calculator
Current Rates
Comparative Market Analysis
Residential Tier · 5 active · 5 closed
Oakland · Single Family Residence
Listed in line with the median closed sale of $600,000. Closed comps sold at 101% of list — strong seller's market.
Price Position
Aligned with the market — fair pricing for the comps.
Active Properties (5)
Active Comparables
| Address | City | Year | BD | BTH | SqFt | LotSz | LP/SqFt | LP | DIM | Score |
|---|---|---|---|---|---|---|---|---|---|---|
| 2712 Logan St | Oakland | 1925 | 3 | 2 | 1,119 | 3,885 | $603 | $675,000 | 4 | 84 |
| 2300 47th AVE | Oakland | 1937 | 2 | 2 | 1,270 | 5,548 | $511 | $649,000 | 10 | 83 |
| 2715 high | Oakland | 1922 | 2 | 1 | 1,258 | 4,240 | $505 | $635,000 | 81 | 82 |
| 4117 Penniman Ct #G | Oakland | 1925 | 2 | 2 | 1,173 | 3,456 | $511 | $599,000 | 80 | 80 |
| 1409 29th | Oakland | 1919 | 3 | 2 | 1,188 | 3,500 | $503 | $598,000 | 2 | 79 |
| Total: 5 · Average | 2.4 | 1.8 | 1,201.6 | 4,125.8 | $526.6 | $631,200 | 35.4 | |||
| Median | 1,188 | $635,000 | ||||||||
Closed Properties (5)
Closed Comparables
| Address | City | Year | Date | BD | BTH | SqFt | LotSz | LP | SP | SP/SqFt | SP/LP | DIM | Score |
|---|---|---|---|---|---|---|---|---|---|---|---|---|---|
| 2533 Harrington Ave | Oakland | 1929 | 06/05/2026 | 3 | 2 | 1,615 | 5,214 | $600,000 | $600,000 | $372 | 1.00 | 91 | 86 |
| 2151 Santa Rita St | Oakland | 1918 | 05/18/2026 | 3 | 2 | 1,209 | 4,165 | $647,000 | $665,000 | $550 | 1.03 | 46 | 85 |
| 3511 Gray Street | Oakland | 1979 | 05/01/2026 | 3 | 2 | 1,372 | 4,569 | $549,000 | $540,000 | $394 | 0.98 | 49 | 83 |
| 2209 35Th Ave | Oakland | 1923 | 08/14/2026 | 3 | 1 | 1,175 | 7,168 | $599,000 | $610,000 | $519 | 1.02 | 79 | 83 |
| 3275 Hyde | Oakland | 1913 | 11/03/2026 | 5 | 2 | 1,510 | 4,000 | $499,000 | $520,000 | $344 | 1.04 | 53 | 83 |
| Total: 5 · Average | 3.4 | 1.8 | 1,376.2 | 5,023.2 | $587,000 | $587,000 | $435.8 | — | 63.6 | ||||
| Median | 1,372 | $600,000 | $600,000 | ||||||||||
Market Analysis
List vs Sale $/SqFt
Sale Price Trend
Days on Market
Sale vs List Price
This analysis was generated automatically from MLS data. For an in-depth, human-reviewed valuation, contact Joseph Sardella at josephsardella@gmail.com.