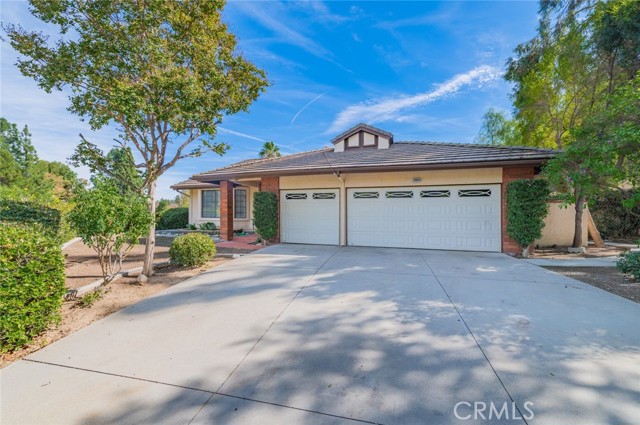
20092 Wildcat Canyon Road, Walnut, CA 91789
20092 Wildcat Canyon Road, Walnut, CA 91789
Property Description
Great location in Ridge Estates. Across from Walnut Ranch Park and Westhoff Elementary. Hard to find single story with vaulted ceilings in Living room, Dining room, Family room, Kitchen and Primary bedroom. Formal living room, formal dining room, Family room with fireplace, Spacious open kitchen with breakfast area Excellent open floor plan with plenty of natural light. Large lot with plenty of room for children to play.
Features & Amenities
Property Details
Mortgage Calculator
Current Rates
Comparative Market Analysis
Residential Tier · 5 active · 5 closed
Walnut · Single Family Residence
Listed 7.4% above the median closed sale of $1,350,000. Price per sqft ($706) is a 11% premium to closed comps ($635). Closed comps sold at 103% of list — strong seller's market.
Price Position
Positioned above the market — commands a premium.
Active Properties (5)
Active Comparables
| Address | City | Year | BD | BTH | SqFt | LotSz | LP/SqFt | LP | DIM | Score |
|---|---|---|---|---|---|---|---|---|---|---|
| 20859 Yellow Feather Cir. | Walnut | 1986 | 4 | 2 | 2,053 | 21,345 | $725 | $1.49M | 10 | 85 |
| 3146 Los Cerillos Drive | West Covina | 1976 | 4 | 3 | 2,090 | 25,720 | $644 | $1.34M | 34 | 78 |
| 880 Gartel | Walnut | 1980 | 4 | 3 | 2,477 | 27,197 | $633 | $1.57M | 80 | 75 |
| 20926 Northview | Walnut | 1987 | 4 | 4 | 2,571 | 10,239 | $556 | $1.43M | 2 | 71 |
| 19855 Vista Hermosa Drive | Walnut | 1977 | 5 | 3 | 2,495 | 8,702 | $573 | $1.43M | 25 | 69 |
| Total: 5 · Average | 4.2 | 3.0 | 2,337.2 | 18,640.6 | $626.2 | $1.45M | 30.2 | |||
| Median | 2,477 | $1.43M | ||||||||
Closed Properties (5)
Closed Comparables
| Address | City | Year | Date | BD | BTH | SqFt | LotSz | LP | SP | SP/SqFt | SP/LP | DIM | Score |
|---|---|---|---|---|---|---|---|---|---|---|---|---|---|
| 20311 E. Yale Ave | Walnut | 1985 | 08/04/2026 | 3 | 3 | 2,067 | 8,328 | $1.29M | $1.32M | $637 | 1.02 | 40 | 83 |
| 20420 Fuerte | Walnut | 1976 | 06/10/2026 | 3 | 2 | 2,028 | 27,574 | $1.20M | $1.32M | $653 | 1.10 | 13 | 82 |
| 20157 Stanford Court | Walnut | 1985 | 09/25/2026 | 4 | 3 | 2,074 | 10,120 | $1.35M | $1.37M | $661 | 1.01 | 55 | 79 |
| 1668 Chestnut Hill | Walnut | 1965 | 11/04/2026 | 3 | 2 | 2,073 | 23,857 | $1.39M | $1.41M | $680 | 1.01 | 32 | 78 |
| 738 Citadel | Walnut | 1977 | 11/04/2026 | 4 | 3 | 2,479 | 8,616 | $1.35M | $1.35M | $545 | 1.00 | 22 | 78 |
| Total: 5 · Average | 3.4 | 2.6 | 2,144.2 | 15,699 | $1.35M | $1.35M | $635.2 | — | 32.4 | ||||
| Median | 2,073 | $1.35M | $1.35M | ||||||||||
Market Analysis
List vs Sale $/SqFt
Sale Price Trend
Days on Market
Sale vs List Price
This analysis was generated automatically from MLS data. For an in-depth, human-reviewed valuation, contact Joseph Sardella at josephsardella@gmail.com.