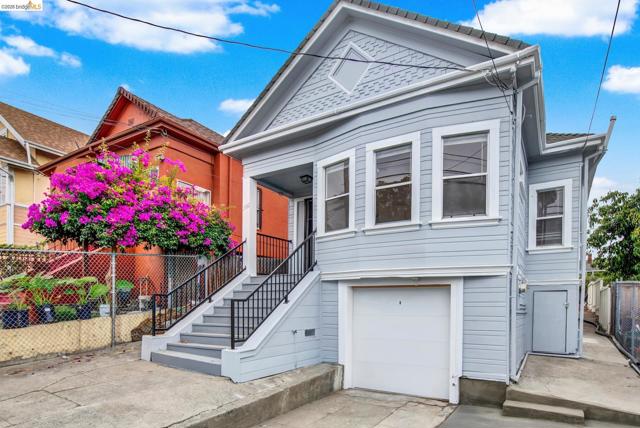
1960 38Th Ave, Oakland, CA 94601
1960 38Th Ave, Oakland, CA 94601
Property Description
Wow! Just finished updating interior! Updated eat-in kitchen including Breakfast bar, Gas stove, microwave oven, dishwasher. New lighting throughout. Refinished Hardwood Floors, Freshly Painted. Big backyard offers many opportunities. Convenient location Near High Street to 880 and 580 Freeways and just up from Foothill Blvd - including shops, restaurants, transportation and schools.
Features & Amenities
Property Details
Mortgage Calculator
Current Rates
Comparative Market Analysis
Affordable Tier · 5 active · 5 closed
Oakland · Single Family Residence
Listed in line with the median closed sale of $520,000. Price per sqft ($616) is a 29% premium to closed comps ($479). Closed comps sold at 103% of list — strong seller's market.
Price Position
Aligned with the market — fair pricing for the comps.
Active Properties (5)
Active Comparables
| Address | City | Year | BD | BTH | SqFt | LotSz | LP/SqFt | LP | DIM | Score |
|---|---|---|---|---|---|---|---|---|---|---|
| 1306 53rd Avenue | Oakland | 1906 | 2 | 1 | 850 | 2,850 | $629 | $535,000 | 89 | 86 |
| 2830 69th | Oakland | 1940 | 2 | 1 | 928 | 3,680 | $533 | $495,000 | 114 | 79 |
| 3818 Suter ST | Oakland | 1925 | 3 | 2 | 792 | 3,465 | $693 | $549,000 | 98 | 77 |
| 1434 40th | Oakland | 1915 | 3 | 3 | 1,294 | 3,850 | $409 | $529,500 | 261 | 69 |
| 2538 16Th St | Oakland | 1985 | 3 | 2 | 1,292 | 3,687 | $378 | $488,000 | 45 | 61 |
| Total: 5 · Average | 2.6 | 1.8 | 1,031.2 | 3,506.4 | $528.4 | $519,300 | 121.4 | |||
| Median | 928 | $529,500 | ||||||||
Closed Properties (5)
Closed Comparables
| Address | City | Year | Date | BD | BTH | SqFt | LotSz | LP | SP | SP/SqFt | SP/LP | DIM | Score |
|---|---|---|---|---|---|---|---|---|---|---|---|---|---|
| 1712 37Th Ave | Oakland | 1910 | 02/20/2026 | 3 | 1 | 1,015 | 3,750 | $488,888 | $530,000 | $522 | 1.08 | 24 | 82 |
| 2426 38Th Ave | Oakland | 1923 | 09/15/2026 | 2 | 1 | 1,187 | 4,800 | $499,800 | $520,000 | $438 | 1.04 | 83 | 78 |
| 2129 Harrington Ave | Oakland | 1922 | 12/03/2025 | 2 | 2 | 1,164 | 4,794 | $480,000 | $479,000 | $412 | 1.00 | 109 | 74 |
| 1464 35Th Ave | Oakland | 1916 | 06/02/2026 | 3 | 2 | 1,133 | 2,910 | $495,000 | $489,200 | $432 | 0.99 | 123 | 74 |
| 2162 35TH Avenue | Oakland | 1946 | 07/06/2026 | 3 | 2 | 966 | 5,050 | $549,000 | $570,000 | $590 | 1.04 | 220 | 73 |
| Total: 5 · Average | 2.6 | 1.6 | 1,093 | 4,260.8 | $517,640 | $517,640 | $478.8 | — | 111.8 | ||||
| Median | 1,133 | $520,000 | $520,000 | ||||||||||
Market Analysis
List vs Sale $/SqFt
Sale Price Trend
Days on Market
Sale vs List Price
This analysis was generated automatically from MLS data. For an in-depth, human-reviewed valuation, contact Joseph Sardella at josephsardella@gmail.com.