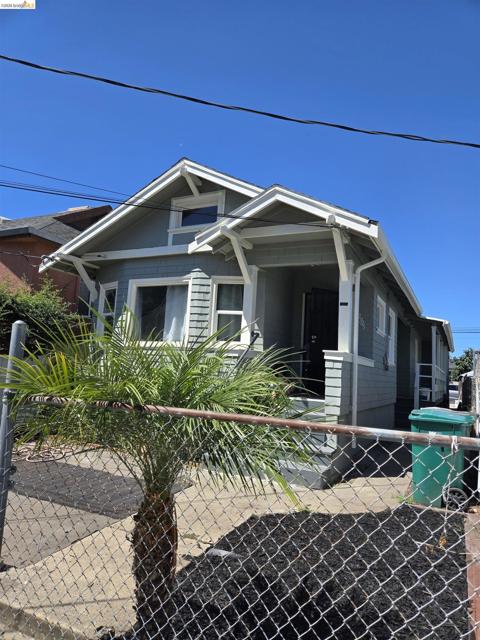
1905 69th ave, Oakland, CA 94621
1905 69th ave, Oakland, CA 94621
Property Description
Beautiful home ready to move in. Get ready to move into your new home. Owner did most of the work you just need to unpack. This home has two street access. One on 69th ave and the back is Church street has parking and big gate. Park your cars in a safe and secure place. And take off to work unnoticed. Enjoy new waterproof vinyl floors and new paint throughout. Nice new shaker cabinets with new appliances. Enjoy gatherings and holidays in a big living area with big back covered deck porch. There is also a third room you can use for office or such. Possible adu in back for future. Very nice house for a great price.
Features & Amenities
Property Details
Mortgage Calculator
Current Rates
Comparative Market Analysis
Affordable Tier · 5 active · 5 closed
Oakland · Single Family Residence
Listed in line with the median closed sale of $460,000. Price per sqft ($437) is a 12% discount to closed comps ($497). Closed comps sold at 95% of list — buyers have negotiating leverage. Expect a longer timeline — comps averaged 133 days on market.
Price Position
Aligned with the market — fair pricing for the comps.
Active Properties (5)
Active Comparables
| Address | City | Year | BD | BTH | SqFt | LotSz | LP/SqFt | LP | DIM | Score |
|---|---|---|---|---|---|---|---|---|---|---|
| 1614 72Nd Ave | Oakland | 1923 | 2 | 1 | 1,020 | 3,960 | $475 | $485,000 | 37 | 91 |
| 7333 Weld St | Oakland | 1923 | 2 | 1 | 924 | 3,800 | $432 | $399,000 | 132 | 88 |
| 7000 Lockwood St | Oakland | 1905 | 2 | 1 | 891 | 4,880 | $511 | $455,000 | 241 | 86 |
| 1649 72Nd Ave | Oakland | 1925 | 3 | 1 | 1,170 | 4,200 | $363 | $424,900 | 6 | 86 |
| 1480 77Th Ave | Oakland | 1923 | 3 | 2 | 1,060 | 3,350 | $460 | $488,000 | 45 | 85 |
| Total: 5 · Average | 2.4 | 1.2 | 1,013 | 4,038 | $448.2 | $450,380 | 92.2 | |||
| Median | 1,020 | $455,000 | ||||||||
Closed Properties (5)
Closed Comparables
| Address | City | Year | Date | BD | BTH | SqFt | LotSz | LP | SP | SP/SqFt | SP/LP | DIM | Score |
|---|---|---|---|---|---|---|---|---|---|---|---|---|---|
| 2621 66th Avenue | Oakland | 1925 | 09/03/2026 | 2 | 1 | 1,056 | 3,963 | $550,000 | $510,000 | $483 | 0.93 | 293 | 90 |
| 7317 Lockwood St | Oakland | 1924 | 10/30/2026 | 2 | 1 | 870 | 4,000 | $444,000 | $440,000 | $506 | 0.99 | 132 | 88 |
| 1672 67th Avenue | Oakland | 1919 | 06/11/2026 | 3 | 2 | 998 | 3,800 | $549,000 | $500,000 | $501 | 0.91 | 42 | 85 |
| 2254 62nd Ave | Oakland | 1923 | 05/20/2026 | 2 | 1 | 856 | 3,040 | $499,000 | $460,000 | $537 | 0.92 | 109 | 84 |
| 2206 66Th Ave | Oakland | 1925 | 01/06/2026 | 2 | 1 | 917 | 3,300 | $425,000 | $420,000 | $458 | 0.99 | 89 | 84 |
| Total: 5 · Average | 2.2 | 1.2 | 939.4 | 3,620.6 | $466,000 | $466,000 | $497 | — | 133 | ||||
| Median | 917 | $460,000 | $460,000 | ||||||||||
Market Analysis
List vs Sale $/SqFt
Sale Price Trend
Days on Market
Sale vs List Price
This analysis was generated automatically from MLS data. For an in-depth, human-reviewed valuation, contact Joseph Sardella at josephsardella@gmail.com.