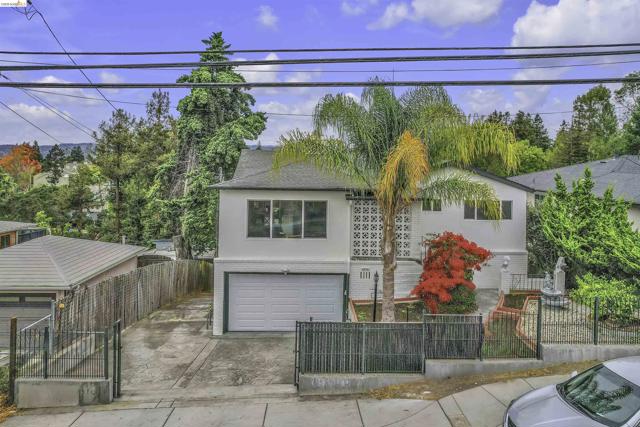
1836 East Ave, Hayward, CA
1836 East Ave, Hayward, CA
Property Description
Tucked in the upscale Hayward Hills, this fully renovated 3 bedroom, 2.5 bathroom home offers plenty of space and spectacular views. It comes with private gated entry with 2 car garage. Hardwood floors flow through the main living areas and kitchen comes equipped with new stainless appliances. The expansive lower floor features additional rooms and a large space that is ideal for entertainment center, home office, or anything else you can dream up. Spacious backyard filled with mature fruit trees that offers a peaceful escape. Don’t miss the opportunity to make this yours!
Features & Amenities
Property Details
Mortgage Calculator
Current Rates
Comparative Market Analysis
Residential Tier · 5 active · 5 closed
Hayward · Single Family Residence
Listed 3.3% below the median closed sale of $930,000. Price per sqft ($367) is a 35% discount to closed comps ($563). Closed comps sold at 103% of list — strong seller's market.
Price Position
Aligned with the market — fair pricing for the comps.
Active Properties (5)
Active Comparables
| Address | City | Year | BD | BTH | SqFt | LotSz | LP/SqFt | LP | DIM | Score |
|---|---|---|---|---|---|---|---|---|---|---|
| 3421 Hackamore Dr | Hayward | 1962 | 4 | 2 | 1,768 | 7,976 | $566 | $999,900 | 23 | 69 |
| 25132 DEL MAR AVE | Hayward | 1965 | 3 | 2 | 1,081 | 4,400 | $722 | $780,000 | 118 | 67 |
| 1724 Germaine Ct | Hayward | 1955 | 3 | 2 | 1,194 | 15,725 | $670 | $800,000 | 2 | 67 |
| 3382 Saddle | Hayward | 1962 | 3 | 2 | 1,657 | 10,324 | $510 | $845,000 | 89 | 65 |
| 2240 Lessley Ave | Castro Valley | 1948 | 3 | 1 | 988 | 5,220 | $810 | $799,888 | 38 | 61 |
| Total: 5 · Average | 3.2 | 1.8 | 1,337.6 | 8,729 | $655.6 | $844,957.6 | 54 | |||
| Median | 1,194 | $800,000 | ||||||||
Closed Properties (5)
Closed Comparables
| Address | City | Year | Date | BD | BTH | SqFt | LotSz | LP | SP | SP/SqFt | SP/LP | DIM | Score |
|---|---|---|---|---|---|---|---|---|---|---|---|---|---|
| 1771 Germaine Ct | 1959 | 09/17/2026 | 3 | 2 | 1,417 | 5,500 | $899,999 | $915,000 | $646 | 1.02 | 48 | 81 | |
| 1800 Weir Dr | Hayward | 1978 | 02/02/2026 | 4 | 3 | 2,576 | 5,526 | $950,000 | $950,000 | $369 | 1.00 | 61 | 80 |
| 24006 Azevedo Ave | Hayward | 1957 | 12/09/2025 | 3 | 3 | 1,640 | 5,000 | $898,000 | $930,000 | $567 | 1.04 | 26 | 79 |
| 1723 Germaine Ct | Hayward | 1956 | 06/12/2026 | 3 | 2 | 1,537 | 6,886 | $890,000 | $980,000 | $638 | 1.10 | 29 | 79 |
| 24805 Canyon View Ct | Hayward | 1957 | 06/09/2026 | 3 | 2 | 1,532 | 7,912 | $899,000 | $913,000 | $596 | 1.02 | 70 | 76 |
| Total: 5 · Average | 3.2 | 2.4 | 1,740.4 | 6,164.8 | $937,600 | $937,600 | $563.2 | — | 46.8 | ||||
| Median | 1,537 | $930,000 | $930,000 | ||||||||||
Market Analysis
List vs Sale $/SqFt
Sale Price Trend
Days on Market
Sale vs List Price
This analysis was generated automatically from MLS data. For an in-depth, human-reviewed valuation, contact Joseph Sardella at josephsardella@gmail.com.