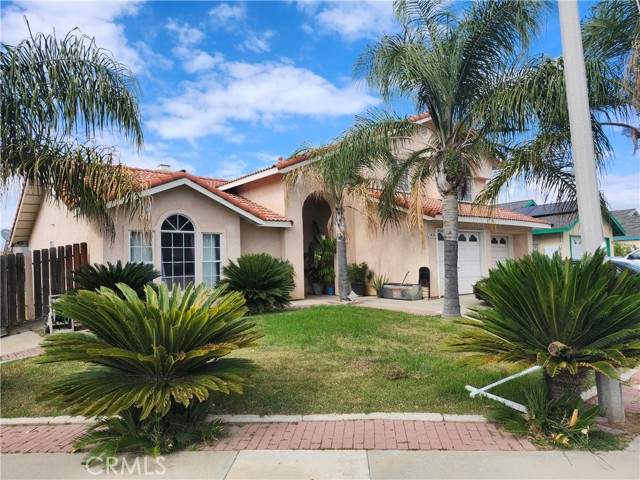
1835 Blossom Avenue, Delano, CA 93215
1835 Blossom Avenue, Delano, CA 93215
Property Description
Delano corner 2 story home, Great Price for the right buyers. 4 Bedrooms with 1 bedroom downstairs and full bathroom downstairs, 3 bedrooms 2 bathroom upstairs, main bedroom has walk in closet, soaking tub, separate shower, and dual sinks. Laundry room has laundry sink and door to exterior, plenty of storage, 2 living areas, one with a fireplace for cold winter nights. Close to schools and park.
Features & Amenities
Property Details
Mortgage Calculator
Current Rates
Comparative Market Analysis
Affordable Tier · 2 active · 5 closed
Delano · Single Family Residence
Listed in line with the median closed sale of $350,000. Price per sqft ($176) is a 23% discount to closed comps ($230). Closed comps sold at 101% of list — strong seller's market.
Price Position
Aligned with the market — fair pricing for the comps.
Active Properties (2)
Active Comparables
| Address | City | Year | BD | BTH | SqFt | LotSz | LP/SqFt | LP | DIM | Score |
|---|---|---|---|---|---|---|---|---|---|---|
| 461 Cabrillo | Delano | 1996 | 3 | 2 | 1,228 | 6,534 | $277 | $340,000 | 19 | 66 |
| 630 Belmont | Delano | 1958 | 3 | 2 | 1,380 | 6,207 | $239 | $329,900 | 27 | 59 |
| Total: 2 · Average | 3.0 | 2.0 | 1,304 | 6,370.5 | $258 | $334,950 | 23 | |||
| Median | 1,380 | $340,000 | ||||||||
Closed Properties (5)
Closed Comparables
| Address | City | Year | Date | BD | BTH | SqFt | LotSz | LP | SP | SP/SqFt | SP/LP | DIM | Score |
|---|---|---|---|---|---|---|---|---|---|---|---|---|---|
| 2214 Quincy | Delano | 1980 | 05/18/2026 | 4 | 3 | 1,397 | 7,332 | $360,000 | $367,000 | $263 | 1.02 | 41 | 82 |
| 2203 19th | Delano | 1990 | 02/03/2026 | 3 | 2 | 1,342 | 7,208 | $330,000 | $335,000 | $250 | 1.01 | 38 | 75 |
| 1820 5th | Delano | 1994 | 08/11/2026 | 4 | 2 | 1,415 | 6,098 | $340,000 | $350,000 | $247 | 1.03 | 60 | 74 |
| 1909 Albany St | Delano | — | 07/13/2026 | 3 | 2 | 0 | 8,276 | $310,000 | $308,000 | $0 | 0.99 | 225 | 63 |
| 838 20TH | Delano | 1953 | 04/02/2026 | 3 | 2 | 2,498 | 15,245 | $399,000 | $399,000 | $160 | 1.00 | 84 | 61 |
| Total: 5 · Average | 3.4 | 2.2 | 1,663 | 8,831.8 | $351,800 | $351,800 | $230 | — | 89.6 | ||||
| Median | 1,415 | $350,000 | $350,000 | ||||||||||
Market Analysis
List vs Sale $/SqFt
Sale Price Trend
Days on Market
Sale vs List Price
This analysis was generated automatically from MLS data. For an in-depth, human-reviewed valuation, contact Joseph Sardella at josephsardella@gmail.com.