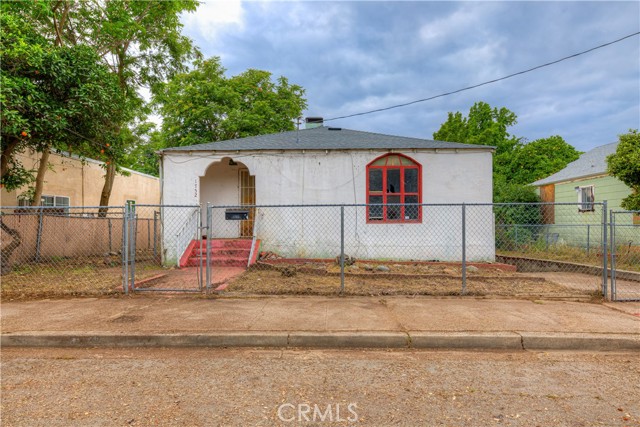
1752 Gray, Oroville, CA 95965
1752 Gray, Oroville, CA 95965
Property Description
New roof on this fixer upper. New shingled roof and new foam installed on the flat portion. Single car garage with an attached basement that can be used as a work shop area and the backyard has a green house perfect for a future gardener. This one is all cleaned out and is a clean slate ready for a fix and flip rehab. Come take a look, do the numbers and submit your offer!!
Features & Amenities
Property Details
Mortgage Calculator
Current Rates
Comparative Market Analysis
Affordable Tier · 1 active · 5 closed
Oroville · Single Family Residence
Listed in line with the median closed sale of $139,000. Price per sqft ($91) is a 36% discount to closed comps ($142). Closed comps sold at 79% of list — buyers have negotiating leverage.
Price Position
Aligned with the market — fair pricing for the comps.
Active Properties (1)
Active Comparables
| Address | City | Year | BD | BTH | SqFt | LotSz | LP/SqFt | LP | DIM | Score |
|---|---|---|---|---|---|---|---|---|---|---|
| 3141 Burlington | Oroville | 1945 | 2 | 1 | 776 | 5,227 | $155 | $119,900 | 57 | 74 |
| Total: 1 · Average | 2.0 | 1.0 | 776 | 5,227 | $155 | $119,900 | 57 | |||
| Median | 776 | $119,900 | ||||||||
Closed Properties (5)
Closed Comparables
| Address | City | Year | Date | BD | BTH | SqFt | LotSz | LP | SP | SP/SqFt | SP/LP | DIM | Score |
|---|---|---|---|---|---|---|---|---|---|---|---|---|---|
| 81 Gaylor | Oroville | 1948 | 06/18/2026 | 3 | 1 | 1,194 | 13,939 | $189,000 | $150,000 | $126 | 0.79 | 42 | 78 |
| 1690 Lincoln Street | Oroville | 1985 | 12/15/2025 | 3 | 2 | 1,232 | 5,663 | $189,000 | $139,000 | $113 | 0.73 | 238 | 75 |
| 1985 Pearl Street | Oroville | 1946 | 12/18/2025 | 2 | 1 | 1,024 | 6,534 | $155,000 | $150,000 | $146 | 0.97 | 78 | 73 |
| 1825 Elgin | Oroville | 1950 | 07/15/2026 | 2 | 1 | 704 | 4,792 | $225,000 | $130,000 | $185 | 0.58 | 90 | 73 |
| 2350 Mesa Avenue | Oroville | 1925 | 09/25/2026 | 2 | 2 | 941 | 5,663 | $150,000 | $131,000 | $139 | 0.87 | 56 | 71 |
| Total: 5 · Average | 2.4 | 1.4 | 1,019 | 7,318.2 | $140,000 | $140,000 | $141.8 | — | 100.8 | ||||
| Median | 1,024 | $139,000 | $139,000 | ||||||||||
Market Analysis
List vs Sale $/SqFt
Sale Price Trend
Days on Market
Sale vs List Price
This analysis was generated automatically from MLS data. For an in-depth, human-reviewed valuation, contact Joseph Sardella at josephsardella@gmail.com.