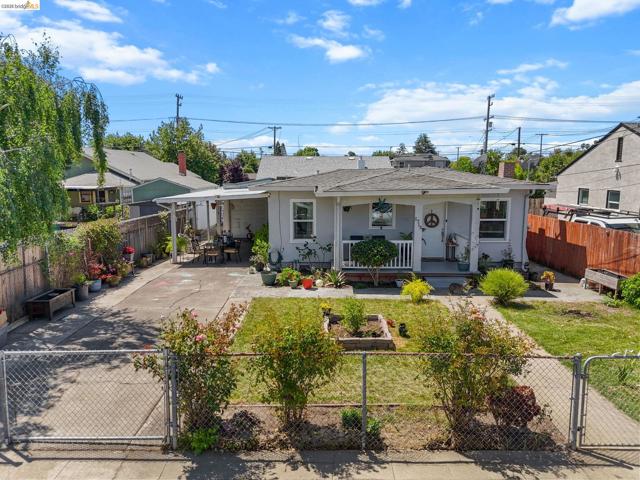
1715 Ohio St, Vallejo, CA 94590
1715 Ohio St, Vallejo, CA 94590
Property Description
Discover the charm and convenience of 1715 Ohio St in Vallejo, a well-located, one level 2-bedroom, 1-bath home offering 992 square feet of bright living space, a functional layout, 4 car driveway and easy access to shopping, schools, parks, and major commuter routes including Hwy 80 and the Mare Island Ferry Terminal—an ideal opportunity for first-time buyers, investors, or anyone seeking a solid property with great potential; buyer to verify all information including room count, square footage, and lot size to their satisfaction.
Features & Amenities
Property Details
Mortgage Calculator
Current Rates
Comparative Market Analysis
Affordable Tier · 4 active · 5 closed
Vallejo · Single Family Residence
Listed 5.9% below the median closed sale of $445,000. Price per sqft ($422) is a 14% discount to closed comps ($489). Closed comps sold at 105% of list — strong seller's market.
Price Position
Priced below the market — value advantage over the field.
Active Properties (4)
Active Comparables
| Address | City | Year | BD | BTH | SqFt | LotSz | LP/SqFt | LP | DIM | Score |
|---|---|---|---|---|---|---|---|---|---|---|
| 1151 Sereno Drive | Vallejo | 1955 | 3 | 2 | 1,082 | 5,663 | $444 | $480,000 | 106 | 64 |
| 1121 5Th St | Vallejo | 1962 | 3 | 2 | 1,032 | 6,969 | $434 | $448,000 | 23 | 63 |
| 2305 Tennessee St | Vallejo | 1951 | 3 | 2 | 1,576 | 6,534 | $285 | $449,900 | 50 | 60 |
| 2417 Sonoma Blvd | Vallejo | 1907 | 4 | 2 | 1,856 | 3,000 | $242 | $449,900 | 100 | 50 |
| Total: 4 · Average | 3.3 | 2.0 | 1,386.5 | 5,541.5 | $351.25 | $456,950 | 69.75 | |||
| Median | 1,576 | $449,900 | ||||||||
Closed Properties (5)
Closed Comparables
| Address | City | Year | Date | BD | BTH | SqFt | LotSz | LP | SP | SP/SqFt | SP/LP | DIM | Score |
|---|---|---|---|---|---|---|---|---|---|---|---|---|---|
| 2019 Georgia St | Vallejo | 1949 | 04/06/2026 | 2 | 1 | 910 | 4,389 | $449,500 | $450,000 | $495 | 1.00 | 54 | 82 |
| 220 13Th St | Vallejo | 1940 | 05/28/2026 | 2 | 1 | 774 | 4,791 | $349,900 | $365,000 | $472 | 1.04 | 41 | 81 |
| 1930 Ohio St | Vallejo | 1936 | 07/22/2026 | 3 | 2 | 1,066 | 6,500 | $395,000 | $445,000 | $417 | 1.13 | 37 | 80 |
| 126 Gleason | Vallejo | 1967 | 11/24/2025 | 2 | 1 | 850 | 2,614 | $419,777 | $450,000 | $529 | 1.07 | 179 | 76 |
| 111 Phelan Ave | Vallejo | 1941 | 12/19/2025 | 2 | 1 | 770 | 6,194 | $399,999 | $408,000 | $530 | 1.02 | 66 | 74 |
| Total: 5 · Average | 2.2 | 1.2 | 874 | 4,897.6 | $423,600 | $423,600 | $488.6 | — | 75.4 | ||||
| Median | 850 | $445,000 | $445,000 | ||||||||||
Market Analysis
List vs Sale $/SqFt
Sale Price Trend
Days on Market
Sale vs List Price
This analysis was generated automatically from MLS data. For an in-depth, human-reviewed valuation, contact Joseph Sardella at josephsardella@gmail.com.