16622 Mossdale, Lancaster, CA 93535
16622 Mossdale, Lancaster, CA 93535
Property Description
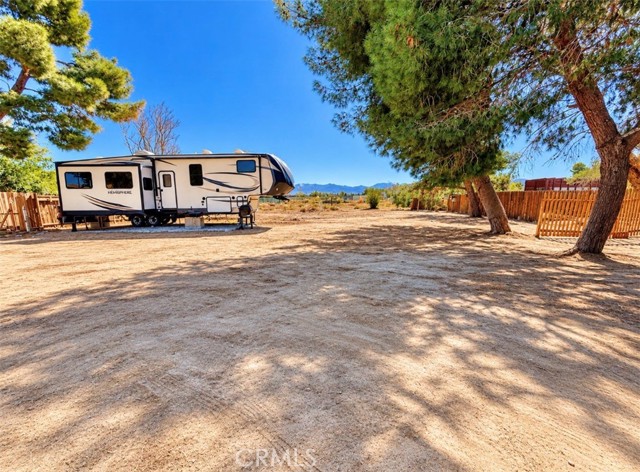
!!! BANK APPROVAL RECEIVED !!! Discover this wonderful opportunity in Lancaster! This home offers 3 bedrooms, 2 bathrooms with 2 additional rooms TOTAL ROOMS 5! The interior includes custom kitchen cabinets, granite countertops, & stainless-steel appliances. The property has central heat & ac, with RV parking AND MORE! Enjoy the benefits of a solar panel system. FHA SHORT SALE PROGRAM APPROVED, EXCELLENT RARE OPPORTUNITY on a spacious 31,867 LOT!!!
Features & Amenities
Property Details
Mortgage Calculator
Current Rates
Comparative Market Analysis
Affordable Tier · 5 active · 5 closed
Lancaster · Single Family Residence
Listed 10.0% above the median closed sale of $400,000. Price per sqft ($234) is a 16% discount to closed comps ($277). Closed comps sold at 102% of list — strong seller's market.
Price Position
Positioned above the market — commands a premium.
Active Properties (5)
Active Comparables
| Address | City | Year | BD | BTH | SqFt | LotSz | LP/SqFt | LP | DIM | Score |
|---|---|---|---|---|---|---|---|---|---|---|
| 40912 169th | Lancaster | 1988 | 3 | 2 | 1,526 | 29,398 | $279 | $425,000 | 107 | 86 |
| 41059 176th Street | Lancaster | 1990 | 3 | 2 | 1,820 | 30,611 | $236 | $429,900 | 27 | 85 |
| 41034 Fieldspring | Lancaster | 1984 | 3 | 2 | 1,402 | 29,444 | $271 | $380,000 | 80 | 84 |
| 16605 Valeport Avenue | Lancaster | 1984 | 3 | 2 | 1,402 | 29,920 | $321 | $449,900 | 30 | 84 |
| 17247 Mossdale | Lancaster | 1979 | 4 | 2 | 1,384 | 31,053 | $289 | $399,900 | 2 | 81 |
| Total: 5 · Average | 3.2 | 2.0 | 1,506.8 | 30,085.2 | $279.2 | $416,940 | 49.2 | |||
| Median | 1,402 | $425,000 | ||||||||
Closed Properties (5)
Closed Comparables
| Address | City | Year | Date | BD | BTH | SqFt | LotSz | LP | SP | SP/SqFt | SP/LP | DIM | Score |
|---|---|---|---|---|---|---|---|---|---|---|---|---|---|
| 16215 Valeport | Lancaster | 1988 | 11/12/2026 | 4 | 2 | 1,490 | 39,479 | $399,900 | $398,500 | $267 | 1.00 | 48 | 82 |
| 40576 161st | Lancaster | 1989 | 04/20/2026 | 4 | 2 | 2,025 | 39,399 | $415,000 | $415,000 | $205 | 1.00 | 53 | 82 |
| 41104 171st | Lancaster | 1987 | 07/15/2026 | 3 | 2 | 1,305 | 29,427 | $395,000 | $415,000 | $318 | 1.05 | 61 | 81 |
| 41038 171st | Lancaster | 1986 | 06/17/2026 | 3 | 2 | 1,320 | 29,408 | $395,000 | $400,000 | $303 | 1.01 | 75 | 81 |
| 40985 174th | Lancaster | 1987 | 05/20/2026 | 3 | 2 | 1,320 | 29,621 | $374,874 | $385,000 | $292 | 1.03 | 97 | 80 |
| Total: 5 · Average | 3.4 | 2.0 | 1,492 | 33,466.8 | $402,700 | $402,700 | $277 | — | 66.8 | ||||
| Median | 1,320 | $400,000 | $400,000 | ||||||||||
Market Analysis
List vs Sale $/SqFt
Sale Price Trend
Days on Market
Sale vs List Price
This analysis was generated automatically from MLS data. For an in-depth, human-reviewed valuation, contact Joseph Sardella at josephsardella@gmail.com.