1 / 7
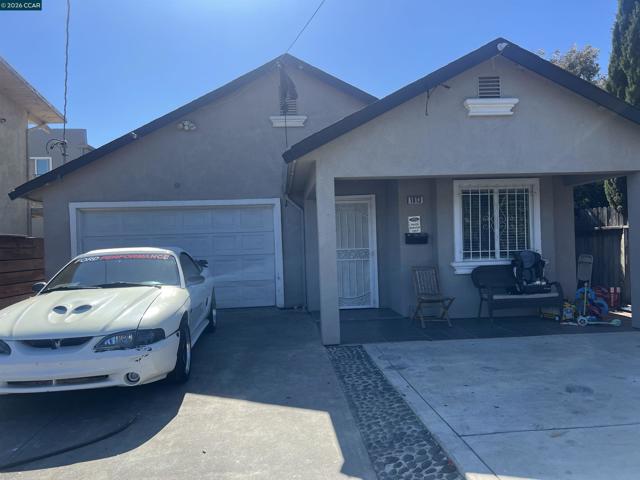
1613 5Th St, Richmond, CA 94801
$540K3bd · 2ba · 1,425 sqft
Lot 3,900 sqft•Single Family Residence•Active•123d on market•MLS# 01-41142155
1613 5Th St, Richmond, CA 94801
MLS# 01-41142155•Residential•Single Family Residence
Active123 days on market
$540,000
3
Beds
2
Baths
1,425
Sq Ft
3,900
Lot Sq Ft
2005
Year Built
Property Description
This is a great opportunity. This house was built in 2008, and it is in good condition. Come and see it. Good size bedrooms Offers will be presented as they come.
Features & Amenities
FeeBuilt 2005
Property Details
Land Type
Fee
Year Built
2005
Property Type
Residential
Property Subtype
Single Family Residence
Parking Spaces
1
Garage Spaces
1
Cooling
None
Flooring
Laminate, Tile
Roof
Shingle
City
Richmond
Zip Code
94801
County
Contra Costa
Mortgage Calculator
Current Rates
$
$
%
Monthly Payment
$2,730.53
Principal & Interest
Loan Amount
$432,000
Total Interest
$550,992
Total Payment Over 30 Years
$982,992
This calculator provides estimates only. Actual mortgage payments may include taxes, insurance, HOA fees, and PMI. Contact a lender for accurate quotes.
Comparative Market Analysis
Affordable Tier · 5 active · 5 closed
1613 5Th St, Richmond, CA 94801
Richmond · Single Family Residence
$540K
Affordable TierBeds
3
Baths
2
Sqft
1,425
Lot
3,900 sqft
Year
2005
$/Sqft
$379
Pool: No✓
Garage: 1-car✓
Listed in line with the median closed sale of $535,000. Price per sqft ($379) is a 17% discount to closed comps ($459). Closed comps sold at 103% of list — strong seller's market.
Price Position
Aligned with the market — fair pricing for the comps.
At market
Subject listed at $540K· $379/sqft
Total list price
Closed comps
vs closed median $535K
+$5K (+0.9%)
Active comps
vs active median $549K
−$9K (−1.6%)
Price per sqft
Closed compsinsufficient comp data
Active comps
vs active avg $/sqft $535
−$156 (−29.2%)
Active Properties (5)
Active Comparables
| Address | City | Year | BD | BTH | SqFt | LotSz | LP/SqFt | LP | DIM | Score |
|---|---|---|---|---|---|---|---|---|---|---|
| 1854 17th Street | San Pablo | 1958 | 3 | 1 | 895 | 3,255 | $592 | $530,000 | 15 | 70 |
| 444 28TH ST | Richmond | 1949 | 3 | 2 | 1,581 | 4,500 | $380 | $600,000 | 20 | 70 |
| 1858 17th Street | San Pablo | 1954 | 2 | 1 | 767 | 3,000 | $639 | $490,000 | 15 | 65 |
| 3315 Humphrey Ave | Richmond | 1951 | 3 | 1 | 1,137 | 2,500 | $492 | $559,900 | 126 | 63 |
| 2190 Giant Rd | San Pablo | 1956 | 3 | 1 | 960 | 7,854 | $572 | $549,000 | 278 | 62 |
| Total: 5 · Average | 2.8 | 1.2 | 1,068 | 4,221.8 | $535 | $545,780 | 90.8 | |||
| Median | 960 | $549,000 | ||||||||
Closed Properties (5)
Closed Comparables
| Address | City | Year | Date | BD | BTH | SqFt | LotSz | LP | SP | SP/SqFt | SP/LP | DIM | Score |
|---|---|---|---|---|---|---|---|---|---|---|---|---|---|
| 1723 Emeric Ave | San Pablo | 2005 | 04/28/2026 | 3 | 2 | 1,098 | 3,375 | $560,000 | $570,000 | $519 | 1.02 | 43 | 85 |
| 101 Sanford Ave | Richmond | 2002 | 04/16/2026 | 3 | 3 | 1,574 | 2,500 | $535,000 | $535,000 | $340 | 1.00 | 120 | 85 |
| 1872 16th Street | San Pablo | 1947 | 08/10/2026 | 3 | 2 | 1,269 | 4,225 | $499,000 | $535,000 | $422 | 1.07 | 109 | 81 |
| 2332 Emeric Ave | Richmond | 1910 | 04/22/2026 | 3 | 2 | 1,058 | 3,290 | $530,000 | $530,000 | $501 | 1.00 | 72 | 72 |
| 1937 Coalinga Ave | Richmond | 1942 | 10/14/2026 | 3 | 1 | 1,164 | 5,000 | $569,000 | $600,000 | $515 | 1.05 | 0 | 71 |
| Total: 5 · Average | 3.0 | 2.0 | 1,232.6 | 3,678 | $554,000 | $554,000 | $459.4 | — | 68.8 | ||||
| Median | 1,164 | $535,000 | $535,000 | ||||||||||
Market Analysis
List vs Sale $/SqFt
Sale Price Trend
Days on Market
Sale vs List Price
AI-generated CMA
This analysis was generated automatically from MLS data. For an in-depth, human-reviewed valuation, contact Joseph Sardella at josephsardella@gmail.com.