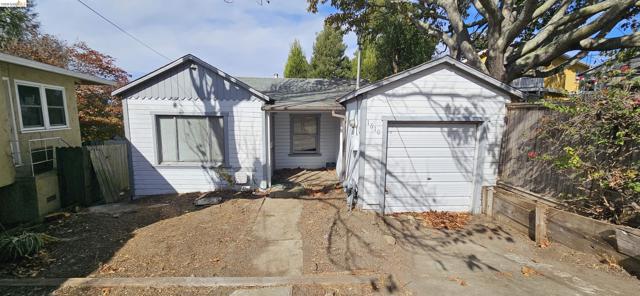
1610 Olive Ave, Richmond, CA 94805
1610 Olive Ave, Richmond, CA 94805
Property Description
Fixer opportunity in the desirable East Richmond Heights community, offering excellent potential for investors or prospective owner-occupants. Situated on a generous lot with a large backyard, this property has ample room for possible additions or expansion. Features include a one-car garage, wood deck and washer/dryer hookups. This home is walkable to schools and a local market, with 5-minute access to BART and I-80 for easy commuting. Located in unincorporated Contra Costa County, this property is exempt from Richmond Rent Control. Don’t miss your chance to customize your dream home or capitalize on the investment potential!
Features & Amenities
Property Details
Mortgage Calculator
Current Rates
Comparative Market Analysis
Affordable Tier · 5 active · 5 closed
Richmond · Single Family Residence
Listed 5.0% below the median closed sale of $525,000. Price per sqft ($730) is a 15% premium to closed comps ($637). Closed comps sold at 106% of list — strong seller's market.
Price Position
Aligned with the market — fair pricing for the comps.
Active Properties (5)
Active Comparables
| Address | City | Year | BD | BTH | SqFt | LotSz | LP/SqFt | LP | DIM | Score |
|---|---|---|---|---|---|---|---|---|---|---|
| 3115 Clinton Ave | Richmond | 1942 | 2 | 1 | 844 | 5,000 | $650 | $549,000 | 22 | 77 |
| 3530 wall | Richmond | 1942 | 2 | 1 | 923 | 5,000 | $541 | $499,000 | 16 | 73 |
| 3400 Mcbryde Ave | Richmond | 1941 | 2 | 1 | 1,035 | 5,000 | $522 | $540,000 | 32 | 71 |
| 1339 Mariposa St | Richmond | 1948 | 2 | 1 | 956 | 3,700 | $596 | $570,000 | 46 | 68 |
| 3521 Center Ave | Richmond | 1912 | 3 | 1 | 1,027 | 5,000 | $535 | $549,500 | 2 | 61 |
| Total: 5 · Average | 2.2 | 1.0 | 957 | 4,740 | $568.8 | $541,500 | 23.6 | |||
| Median | 956 | $549,000 | ||||||||
Closed Properties (5)
Closed Comparables
| Address | City | Year | Date | BD | BTH | SqFt | LotSz | LP | SP | SP/SqFt | SP/LP | DIM | Score |
|---|---|---|---|---|---|---|---|---|---|---|---|---|---|
| 418 44Th St | Richmond | 1940 | 08/04/2026 | 2 | 1 | 800 | 3,382 | $489,000 | $550,000 | $688 | 1.13 | 48 | 82 |
| 5418 Solano Ave | Richmond | 1941 | 04/27/2026 | 2 | 1 | 888 | 4,800 | $499,000 | $525,000 | $591 | 1.05 | 38 | 80 |
| 120 39Th St | Richmond | 1943 | 07/27/2026 | 2 | 1 | 752 | 5,000 | $469,999 | $540,000 | $718 | 1.15 | 28 | 80 |
| 3417 Maricopa Ave | Richmond | 1941 | 09/23/2026 | 2 | 1 | 789 | 5,000 | $485,000 | $490,000 | $621 | 1.01 | 57 | 79 |
| 143 42nd ST | Richmond | 1946 | 07/14/2026 | 2 | 1 | 779 | 3,659 | $467,999 | $440,000 | $565 | 0.94 | 15 | 79 |
| Total: 5 · Average | 2.0 | 1.0 | 801.6 | 4,368.2 | $509,000 | $509,000 | $636.6 | — | 37.2 | ||||
| Median | 789 | $525,000 | $525,000 | ||||||||||
Market Analysis
List vs Sale $/SqFt
Sale Price Trend
Days on Market
Sale vs List Price
This analysis was generated automatically from MLS data. For an in-depth, human-reviewed valuation, contact Joseph Sardella at josephsardella@gmail.com.