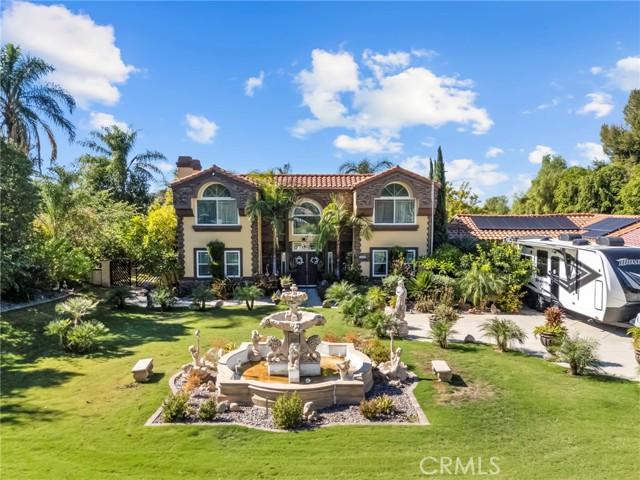
16083 Regency Ranch, Riverside, CA 92504
16083 Regency Ranch, Riverside, CA 92504
Property Description
Welcome to 16083 Regency Ranch . Beautiful 5 bedroom home on a large lot .Too many upgrades to mention from manicured lawns to elegant concrete patio and volleyball /pickle ball court area. Gated and large driveway +rv parking . Home features an outdoor sauna,outdoor shower,outdoor restroom ,open concept out door kitchen, gazebo and outdoor bar area. Spacious driveway and upgraded driveway ,rv parking space and extended garage . Upgraded electrical /panels over 200 k value fully paid off. Schedule your tour today
Features & Amenities
Property Details
Mortgage Calculator
Current Rates
Comparative Market Analysis
Luxury Tier · 5 active · 5 closed
Riverside · Single Family Residence
Listed 5.7% above the median closed sale of $1,230,000. Price per sqft ($379) is a 15% premium to closed comps ($329). Closed comps sold at 102% of list — strong seller's market. Luxury tier — fewer comparable sales widen the confidence range.
Price Position
Positioned above the market — commands a premium.
Active Properties (5)
Active Comparables
| Address | City | Year | BD | BTH | SqFt | LotSz | LP/SqFt | LP | DIM | Score |
|---|---|---|---|---|---|---|---|---|---|---|
| 17660 Mariposa | Riverside | 2004 | 6 | 3 | 2,880 | 57,499 | $434 | $1.25M | 28 | 60 |
| 1173 Matterhorn | Riverside | 2022 | 5 | 5 | 3,676 | 24,494 | $367 | $1.35M | 22 | 60 |
| 13550 Pointer Court | Riverside | 2019 | 4 | 3 | 3,566 | 18,295 | $414 | $1.48M | 9 | 58 |
| 7700 Westpark Drive | Riverside | 1989 | 4 | 4 | 2,552 | 30,056 | $490 | $1.25M | 38 | 58 |
| 17881 Canyonwood Drive | Riverside | 2004 | 4 | 5 | 4,257 | 43,996 | $265 | $1.13M | 11 | 57 |
| Total: 5 · Average | 4.6 | 4.0 | 3,386.2 | 34,868 | $394 | $1.29M | 21.6 | |||
| Median | 3,566 | $1.25M | ||||||||
Closed Properties (5)
Closed Comparables
| Address | City | Year | Date | BD | BTH | SqFt | LotSz | LP | SP | SP/SqFt | SP/LP | DIM | Score |
|---|---|---|---|---|---|---|---|---|---|---|---|---|---|
| 16948 Alita | Riverside | 2000 | 12/11/2025 | 4 | 5 | 3,964 | 39,204 | $1.40M | $1.38M | $347 | 0.98 | 69 | 77 |
| 15555 Rancho Viejo Drive | Riverside | 1985 | 05/14/2026 | 4 | 3 | 3,338 | 45,302 | $1.10M | $1.20M | $359 | 1.09 | 56 | 69 |
| 16947 Orangecrest Court | Riverside | 2017 | 09/14/2026 | 5 | 5 | 4,748 | 38,333 | $1.50M | $1.50M | $315 | 1.00 | 48 | 69 |
| 16575 Bonanza Dr | Riverside | 1989 | 07/17/2026 | 3 | 4 | 3,845 | 43,996 | $1.20M | $1.23M | $320 | 1.03 | 174 | 68 |
| 14329 Dove Canyon | Riverside | 2002 | 05/29/2026 | 5 | 5 | 3,758 | 16,553 | $1.15M | $1.15M | $306 | 1.00 | 36 | 65 |
| Total: 5 · Average | 4.2 | 4.4 | 3,930.6 | 36,677.6 | $1.29M | $1.29M | $329.4 | — | 76.6 | ||||
| Median | 3,845 | $1.23M | $1.23M | ||||||||||
Market Analysis
List vs Sale $/SqFt
Sale Price Trend
Days on Market
Sale vs List Price
This analysis was generated automatically from MLS data. For an in-depth, human-reviewed valuation, contact Joseph Sardella at josephsardella@gmail.com.