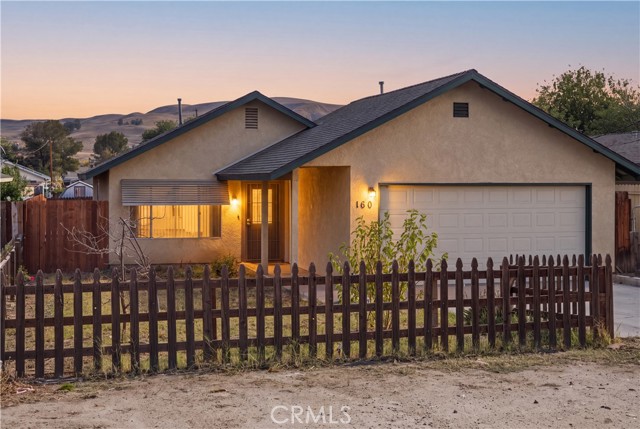
160 North 3rd, Shandon, CA 93461
160 North 3rd, Shandon, CA 93461
Property Description
Whether you’re ready to purchase your first home, looking for your next investment, or searching for a place to make your own, this is your chance to explore the possibilities of homeownership in Shandon! Imagine the possibilities at 160 N. 3rd Street! This inviting 3-bedroom, 2-bathroom home offers small-town charm, beautiful foothill views, a new backyard fence, and a leveled backyard ready for your personal touch. Whether you’re dreaming of purchasing your first home, looking for an investment opportunity, or creating a space to call your own, this home is full of potential. Take the first step toward making homeownership a reality and discover all the possibilities Shandon has to offer. Your next chapter could start here — schedule your showing today!
Features & Amenities
Property Details
Mortgage Calculator
Current Rates
Comparative Market Analysis
Affordable Tier · 0 active · 5 closed
Shandon · Single Family Residence
Listed 9.5% above the median closed sale of $465,000. Price per sqft ($442) is a 14% premium to closed comps ($388). Closed comps sold at 101% of list — strong seller's market.
Price Position
Positioned above the market — commands a premium.
Closed Properties (5)
Closed Comparables
| Address | City | Year | Date | BD | BTH | SqFt | LotSz | LP | SP | SP/SqFt | SP/LP | DIM | Score |
|---|---|---|---|---|---|---|---|---|---|---|---|---|---|
| 165 5th Street | Shandon | 1993 | 09/15/2026 | 3 | 2 | 1,134 | 7,000 | $459,000 | $459,000 | $405 | 1.00 | 85 | 97 |
| 155 South 2nd Street | Shandon | 1979 | 06/11/2026 | 3 | 2 | 1,088 | 7,000 | $459,900 | $465,000 | $427 | 1.01 | 34 | 93 |
| 170 1st | Shandon | 1983 | 09/25/2026 | 3 | 2 | 1,439 | 6,900 | $549,000 | $540,000 | $375 | 0.98 | 18 | 90 |
| 150 7th Street | Shandon | 2004 | 09/11/2026 | 3 | 2 | 1,218 | 8,250 | $500,000 | $510,000 | $419 | 1.02 | 49 | 90 |
| 210 Calle Arroyo | Shandon | 2001 | 05/12/2026 | 3 | 2 | 1,378 | 8,000 | $419,900 | $435,000 | $316 | 1.04 | 34 | 86 |
| Total: 5 · Average | 3.0 | 2.0 | 1,251.4 | 7,430 | $481,800 | $481,800 | $388.4 | — | 44 | ||||
| Median | 1,218 | $465,000 | $465,000 | ||||||||||
Market Analysis
List vs Sale $/SqFt
Sale Price Trend
Days on Market
Sale vs List Price
This analysis was generated automatically from MLS data. For an in-depth, human-reviewed valuation, contact Joseph Sardella at josephsardella@gmail.com.