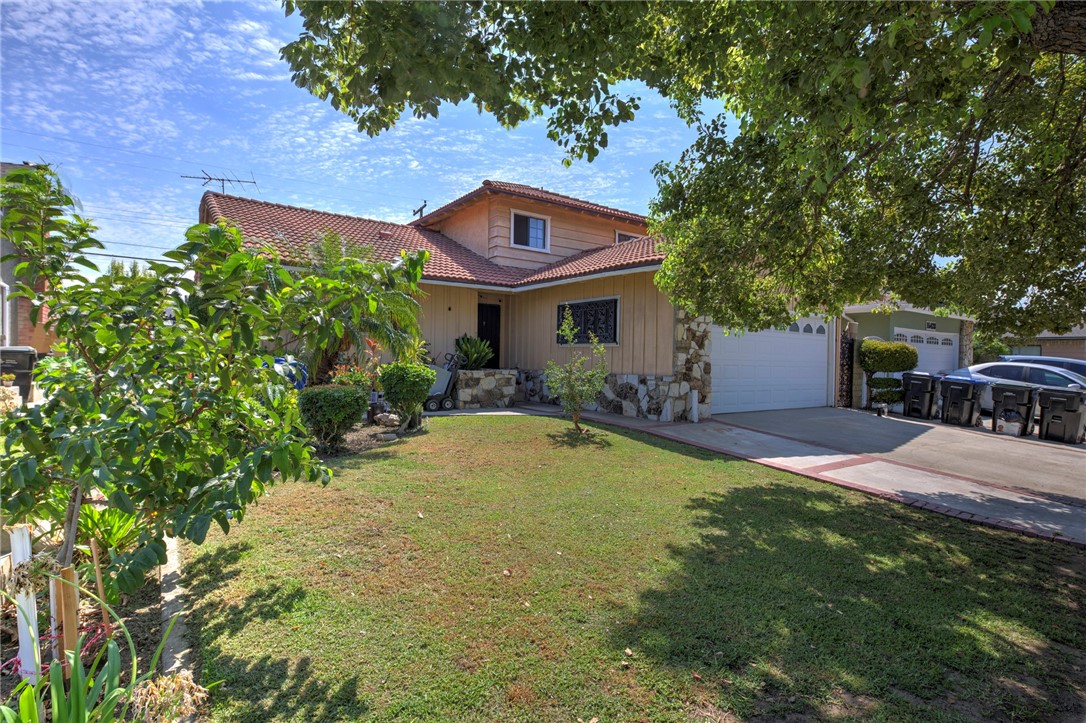
1 / 22
15422 Benfield, Norwalk, CA 90650
$980K4bd · 2ba · 2,290 sqft
Lot 5,241 sqft•Single Family Residence•Active•68d on market•MLS# DW-26199341
15422 Benfield, Norwalk, CA 90650
MLS# DW-26199341•Residential•Single Family Residence
Active68 days on market
$980,000
4
Beds
2
Baths
2,290
Sq Ft
5,241
Lot Sq Ft
1964
Year Built
None
View
Property Description
Beautiful 2 story 4 bedroom 2 bath home with a swimming pool for the family to enjoy in the summertime. Great location in the charming city of Norwalk.
Features & Amenities
FeeBuilt 1964
Property Details
Land Type
Fee
Year Built
1964
Property Type
Residential
Property Subtype
Single Family Residence
Parking Spaces
2
Garage Spaces
2
Heating
Central
Cooling
Central Air
View
None
City
Norwalk
Zip Code
90650
County
Los Angeles
Mortgage Calculator
Current Rates
$
$
%
Monthly Payment
$4,955.41
Principal & Interest
Loan Amount
$784,000
Total Interest
$999,949
Total Payment Over 30 Years
$1,783,949
This calculator provides estimates only. Actual mortgage payments may include taxes, insurance, HOA fees, and PMI. Contact a lender for accurate quotes.
Comparative Market Analysis
Residential Tier · 5 active · 5 closed
15422 Benfield, Norwalk, CA 90650
Norwalk · Single Family Residence
$980K
Residential TierBeds
4
Baths
2
Sqft
2,290
Lot
5,241 sqft
Year
1964
$/Sqft
$428
Pool: Yes✓
View: None✓
Garage: 2-car✓
Listed 16.0% above the median closed sale of $845,000. Price per sqft ($428) is a 35% discount to closed comps ($660). Closed comps sold at 102% of list — strong seller's market.
Price Position
Positioned above the market — commands a premium.
Premium
Subject listed at $980K· $428/sqft
Total list price
Closed comps
vs closed median $845K
+$135K (+16.0%)
Active comps
vs active median $885K
+$95K (+10.7%)
Price per sqft
Closed compsinsufficient comp data
Active comps
vs active avg $/sqft $572
−$144 (−25.2%)
Active Properties (5)
Active Comparables
| Address | City | Year | BD | BTH | SqFt | LotSz | LP/SqFt | LP | DIM | Score |
|---|---|---|---|---|---|---|---|---|---|---|
| 15615 Harvest Avenue | Norwalk | 1955 | 3 | 2 | 1,726 | 5,112 | $513 | $885,000 | 21 | 77 |
| 15515 Harvest | Norwalk | 1955 | 4 | 3 | 1,649 | 5,092 | $539 | $888,777 | 16 | 77 |
| 14312 Dumont | Norwalk | 1950 | 3 | 2 | 1,206 | 5,411 | $726 | $875,800 | 26 | 76 |
| 11551 Everston Street | Norwalk | 1950 | 3 | 2 | 1,415 | 6,151 | $601 | $849,900 | 6 | 72 |
| 15324 Piuma | Norwalk | 1953 | 4 | 2 | 2,048 | 11,873 | $483 | $989,900 | 5 | 71 |
| Total: 5 · Average | 3.4 | 2.2 | 1,608.8 | 6,727.8 | $572.4 | $897,875.4 | 14.8 | |||
| Median | 1,649 | $885,000 | ||||||||
Closed Properties (5)
Closed Comparables
| Address | City | Year | Date | BD | BTH | SqFt | LotSz | LP | SP | SP/SqFt | SP/LP | DIM | Score |
|---|---|---|---|---|---|---|---|---|---|---|---|---|---|
| 14808 Dalwood Drive | Norwalk | 1948 | 09/15/2026 | 3 | 2 | 1,170 | 6,003 | $819,900 | $845,000 | $722 | 1.03 | 46 | 78 |
| 15429 Piuma | Norwalk | 1953 | 11/13/2026 | 3 | 1 | 1,050 | 5,489 | $839,997 | $840,000 | $800 | 1.00 | 72 | 77 |
| 15532 Allingham | Norwalk | 1956 | 03/03/2026 | 3 | 2 | 1,642 | 6,112 | $850,000 | $860,000 | $524 | 1.01 | 145 | 73 |
| 15432 Gridley | Norwalk | 1947 | 10/13/2026 | 3 | 2 | 1,601 | 6,702 | $850,000 | $865,000 | $540 | 1.02 | 31 | 71 |
| 11413 Hayford | Norwalk | 1947 | 09/01/2026 | 3 | 2 | 1,167 | 5,654 | $795,000 | $835,000 | $716 | 1.05 | 38 | 69 |
| Total: 5 · Average | 3.0 | 1.8 | 1,326 | 5,992 | $849,000 | $849,000 | $660.4 | — | 66.4 | ||||
| Median | 1,170 | $845,000 | $845,000 | ||||||||||
Market Analysis
List vs Sale $/SqFt
Sale Price Trend
Days on Market
Sale vs List Price
AI-generated CMA
This analysis was generated automatically from MLS data. For an in-depth, human-reviewed valuation, contact Joseph Sardella at josephsardella@gmail.com.