1 / 10
15 East Swift, Orland, CA 95963
$350K3bd · 1ba · 1,280 sqft
Lot 8,712 sqft•Single Family Residence•Active•29d on market•MLS# SN-26227539
15 East Swift, Orland, CA 95963
MLS# SN-26227539•Residential•Single Family Residence
Active29 days on market
$349,900
3
Beds
1
Baths
1,280
Sq Ft
8,712
Lot Sq Ft
1960
Year Built
Property Description
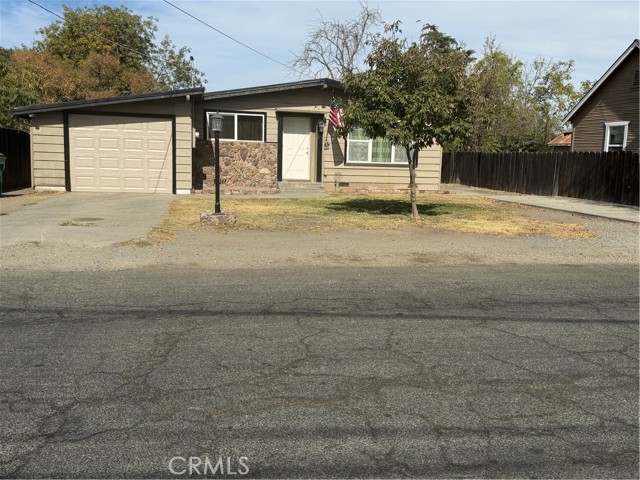
Nice Ranch style home with original hardwood floors, rock fireplace (non operational) mostly all new cabinets in Kitchen, new range, remodeled Bathroom.
Features & Amenities
FeeBuilt 1960
Property Details
Land Type
Fee
Year Built
1960
Property Type
Residential
Property Subtype
Single Family Residence
Parking Spaces
1
Garage Spaces
1
Heating
Central
Cooling
Central Air
Flooring
Vinyl, Wood
Roof
Composition
City
Orland
Zip Code
95963
County
Glenn
Mortgage Calculator
Current Rates
$
$
%
Monthly Payment
$1,769.28
Principal & Interest
Loan Amount
$279,920
Total Interest
$357,023
Total Payment Over 30 Years
$636,943
This calculator provides estimates only. Actual mortgage payments may include taxes, insurance, HOA fees, and PMI. Contact a lender for accurate quotes.
Comparative Market Analysis
Affordable Tier · 5 active · 5 closed
15 East Swift, Orland, CA 95963
Orland · Single Family Residence
$350K
Affordable TierBeds
3
Baths
1
Sqft
1,280
Lot
8,712 sqft
Year
1960
$/Sqft
$273
Pool: No✓
Spa: No✓
Garage: 1-car✓
Listed in line with the median closed sale of $350,000.
Price Position
Aligned with the market — fair pricing for the comps.
At market
Subject listed at $350K· $273/sqft
Total list price
Closed comps
vs closed median $350K
−$100 (−0.0%)
Active comps
vs active median $359K
−$9K (−2.5%)
Price per sqft
Closed compsinsufficient comp data
Active comps
vs active avg $/sqft $274
−$1 (−0.2%)
Active Properties (5)
Active Comparables
| Address | City | Year | BD | BTH | SqFt | LotSz | LP/SqFt | LP | DIM | Score |
|---|---|---|---|---|---|---|---|---|---|---|
| 139 E Yolo Street | Orland | 1962 | 3 | 2 | 1,288 | 15,246 | $279 | $359,000 | 36 | 88 |
| 327 EAST Street | Orland | 1977 | 3 | 2 | 1,290 | 6,969 | $275 | $355,000 | 50 | 88 |
| 232 Plumas Street | Orland | 1955 | 4 | 2 | 1,506 | 5,227 | $262 | $395,000 | 86 | 84 |
| 439 3rd Street | Orland | 1950 | 2 | 1 | 1,020 | 5,227 | $312 | $318,000 | 101 | 82 |
| 225 Mellane Circle | Orland | 1971 | 3 | 2 | 1,578 | 9,148 | $240 | $379,000 | 162 | 80 |
| Total: 5 · Average | 3.0 | 1.8 | 1,336.4 | 8,363.4 | $273.6 | $361,200 | 87 | |||
| Median | 1,290 | $359,000 | ||||||||
Closed Properties (5)
Closed Comparables
| Address | City | Year | Date | BD | BTH | SqFt | LotSz | LP | SP | SP/SqFt | SP/LP | DIM | Score |
|---|---|---|---|---|---|---|---|---|---|---|---|---|---|
| 64 Tehama | Orland | 1954 | 12/30/2025 | 3 | 1 | 1,115 | 9,583 | $340,000 | $350,000 | $314 | 1.03 | 22 | 86 |
| 65 Colusa | Orland | 1924 | 05/13/2026 | 3 | 2 | 1,237 | 8,276 | $360,000 | $350,000 | $283 | 0.97 | 52 | 82 |
| 620 1st Street | Orland | 1955 | 09/21/2026 | 3 | 2 | 1,737 | 10,400 | $390,000 | $371,000 | $214 | 0.95 | 61 | 82 |
| 919 East Street | Orland | 1965 | 07/13/2026 | 3 | 2 | 1,530 | 8,276 | $389,900 | $394,900 | $258 | 1.01 | 137 | 82 |
| 113 Swift Street | Orland | 1948 | 01/12/2026 | 2 | 1 | 1,129 | 9,583 | $305,000 | $307,000 | $272 | 1.01 | 47 | 81 |
| Total: 5 · Average | 2.8 | 1.6 | 1,349.6 | 9,223.6 | $354,580 | $354,580 | $268.2 | — | 63.8 | ||||
| Median | 1,237 | $350,000 | $350,000 | ||||||||||
Market Analysis
List vs Sale $/SqFt
Sale Price Trend
Days on Market
Sale vs List Price
AI-generated CMA
This analysis was generated automatically from MLS data. For an in-depth, human-reviewed valuation, contact Joseph Sardella at josephsardella@gmail.com.