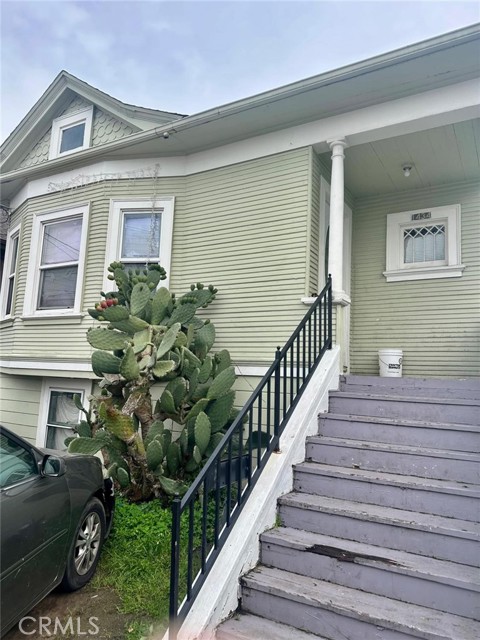
1434 40th, Oakland, CA 94601
1434 40th, Oakland, CA 94601
Property Description
Two homes on one lot offer a fantastic opportunity for homeowners and investors alike. The main residence features 2 bedrooms, 1.5 bathrooms, and a basement with two additional room is ideal for extra living space, a home office, or storage. A detached ADU includes 1 bedroom, 1 bathroom, a kitchen, and a separate entrance, providing excellent potential for rental income or multigenerational living. With a little TLC, this property can truly shine. Don't miss the chance to live in one home while generating additional income from the ADU.
Features & Amenities
Property Details
Mortgage Calculator
Current Rates
Comparative Market Analysis
Affordable Tier · 5 active · 5 closed
Oakland · Single Family Residence
Listed 6.3% below the median closed sale of $565,000. Closed comps sold at 102% of list — strong seller's market. Expect a longer timeline — comps averaged 178 days on market.
Price Position
Priced below the market — value advantage over the field.
Active Properties (5)
Active Comparables
| Address | City | Year | BD | BTH | SqFt | LotSz | LP/SqFt | LP | DIM | Score |
|---|---|---|---|---|---|---|---|---|---|---|
| 1409 29th | Oakland | 1919 | 3 | 2 | 1,188 | 3,500 | $503 | $598,000 | 2 | 82 |
| 2080 Harrington Ave | Oakland | 1921 | 3 | 2 | 1,504 | 4,975 | $399 | $599,500 | 22 | 80 |
| 2538 16Th St | Oakland | 1985 | 3 | 2 | 1,292 | 3,687 | $378 | $488,000 | 45 | 76 |
| 1960 38Th Ave | Oakland | 1911 | 2 | 1 | 843 | 3,600 | $616 | $519,500 | 22 | 73 |
| 1306 53rd Avenue | Oakland | 1906 | 2 | 1 | 850 | 2,850 | $629 | $535,000 | 89 | 67 |
| Total: 5 · Average | 2.6 | 1.6 | 1,135.4 | 3,722.4 | $505 | $548,000 | 36 | |||
| Median | 1,188 | $535,000 | ||||||||
Closed Properties (5)
Closed Comparables
| Address | City | Year | Date | BD | BTH | SqFt | LotSz | LP | SP | SP/SqFt | SP/LP | DIM | Score |
|---|---|---|---|---|---|---|---|---|---|---|---|---|---|
| 4019 16Th St | Oakland | 1918 | 05/20/2026 | 3 | 2 | 1,468 | 3,570 | $565,000 | $565,000 | $385 | 1.00 | 114 | 88 |
| 907 39Th Ave | Oakland | 1920 | 11/12/2026 | 4 | 2 | 1,283 | 3,750 | $499,000 | $600,000 | $468 | 1.20 | 34 | 84 |
| 1464 35Th Ave | Oakland | 1916 | 06/02/2026 | 3 | 2 | 1,133 | 2,910 | $495,000 | $489,200 | $432 | 0.99 | 123 | 83 |
| 2918 Foothill Blvd | Oakland | 1908 | 08/13/2026 | 3 | 1 | 1,132 | 4,200 | $499,000 | $460,000 | $406 | 0.92 | 569 | 80 |
| 5334 10th St. | Oakland | 1910 | 05/11/2026 | 3 | 2 | 1,264 | 2,798 | $599,000 | $600,000 | $475 | 1.00 | 48 | 79 |
| Total: 5 · Average | 3.2 | 1.8 | 1,256 | 3,445.6 | $542,840 | $542,840 | $433.2 | — | 177.6 | ||||
| Median | 1,264 | $565,000 | $565,000 | ||||||||||
Market Analysis
List vs Sale $/SqFt
Sale Price Trend
Days on Market
Sale vs List Price
This analysis was generated automatically from MLS data. For an in-depth, human-reviewed valuation, contact Joseph Sardella at josephsardella@gmail.com.