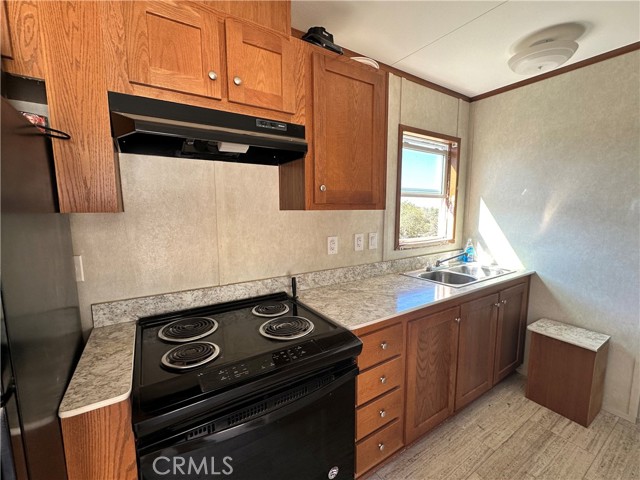
1403 Forbestown, Oroville, CA 95966
1403 Forbestown, Oroville, CA 95966
Property Description
Discover the possibilities with this charming 1-bedroom, 1-bathroom home situated on 3.98 acres in Oroville’s desirable East Foothills! With nearly 4 acres, this property offers plenty of room to enjoy the outdoors, create your own private retreat, or explore future possibilities. Just minutes from beautiful Lake Oroville, you'll have easy access to boating, fishing, hiking, and endless outdoor recreation. Whether you're looking for a peaceful getaway, a full-time residence, or an investment opportunity, this property offers a great combination of acreage, location, and potential!
Features & Amenities
Property Details
Mortgage Calculator
Current Rates
Comparative Market Analysis
Affordable Tier · 3 active · 2 closed
Oroville · Manufactured On Land
Listed 9.2% above the median closed sale of $141,925. Price per sqft ($373) is a 144% premium to closed comps ($153). Expect a longer timeline — comps averaged 158 days on market.
Price Position
Positioned above the market — commands a premium.
Active Properties (3)
Active Comparables
| Address | City | Year | BD | BTH | SqFt | LotSz | LP/SqFt | LP | DIM | Score |
|---|---|---|---|---|---|---|---|---|---|---|
| 520 Black Bart | Oroville | 1979 | 2 | 2 | 800 | 125,453 | $186 | $149,000 | 140 | 45 |
| 300 Purple Rocks | Oroville | 1999 | 2 | 2 | 800 | 862,052 | $211 | $169,000 | 40 | 39 |
| 233 Renegade Road | Oroville | 1975 | 3 | 3 | 960 | 142,441 | $156 | $150,000 | 568 | 31 |
| Total: 3 · Average | 2.3 | 2.3 | 853.333 | 376,648.667 | $184.333 | $156,000 | 249.33333333333334 | |||
| Median | 800 | $150,000 | ||||||||
Closed Properties (2)
Closed Comparables
| Address | City | Year | Date | BD | BTH | SqFt | LotSz | LP | SP | SP/SqFt | SP/LP | DIM | Score |
|---|---|---|---|---|---|---|---|---|---|---|---|---|---|
| 140 Wayman Lane | Oroville | 2012 | 10/29/2025 | 2 | 2 | 900 | 361,112 | $147,000 | $143,850 | $160 | 0.98 | 238 | 42 |
| 128 Shirley Lane | Oroville | 2000 | 10/09/2026 | 3 | 2 | 960 | 354,143 | $150,000 | $140,000 | $146 | 0.93 | 79 | 41 |
| Total: 2 · Average | 2.5 | 2.0 | 930 | 357,627.5 | $141,925 | $141,925 | $153 | — | 158.5 | ||||
| Median | 960 | $143,850 | $143,850 | ||||||||||
Market Analysis
List vs Sale $/SqFt
Sale Price Trend
Days on Market
Sale vs List Price
This analysis was generated automatically from MLS data. For an in-depth, human-reviewed valuation, contact Joseph Sardella at josephsardella@gmail.com.