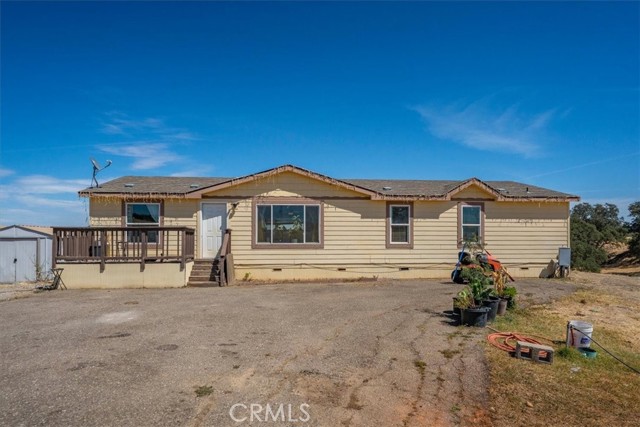
14020 Eastridge, Red Bluff, CA 96080
14020 Eastridge, Red Bluff, CA 96080
Property Description
Welcome to 14020 Eastridge Dr! This 3-bedroom, 2-bath manufactured home offers approximately 1,600 sq ft of living space on an expansive 10.8-acre rural property. Built in 2011, the home features a comfortable single-level layout with central heating and cooling. The property offers plenty of open space, privacy, and beautiful country surroundings, along with a detached two-car garage/shop providing additional space for vehicles, equipment, storage, or hobbies. A private driveway leads to the residence, creating a peaceful setting with room to enjoy the outdoors. Located in the Red Bluff area, this property is a great opportunity for buyers looking for acreage, privacy, and the flexibility of rural living. Come explore the space and possibilities this unique property has to offer!
Features & Amenities
Property Details
Mortgage Calculator
Current Rates
Comparative Market Analysis
Affordable Tier · 0 active · 5 closed
Red Bluff · Single Family Residence
Listed in line with the median closed sale of $322,000. Price per sqft ($203) is a 18% discount to closed comps ($247).
Price Position
Aligned with the market — fair pricing for the comps.
Closed Properties (5)
Closed Comparables
| Address | City | Year | Date | BD | BTH | SqFt | LotSz | LP | SP | SP/SqFt | SP/LP | DIM | Score |
|---|---|---|---|---|---|---|---|---|---|---|---|---|---|
| 1950 Gentry Way | Red Bluff | 2005 | 07/02/2026 | 3 | 2 | 1,300 | 7,841 | $345,000 | $335,000 | $258 | 0.97 | 43 | 68 |
| 2132 Reta Way | Red Bluff | 2005 | 03/27/2026 | 5 | 2 | 1,460 | 6,534 | $344,000 | $340,000 | $233 | 0.99 | 43 | 64 |
| 2420 Oriole Drive | Red Bluff | 1980 | 12/31/2025 | 3 | 2 | 1,248 | 6,098 | $285,000 | $285,000 | $228 | 1.00 | 94 | 53 |
| 2520 Oriole | Red Bluff | 1980 | 08/07/2026 | 2 | 2 | 1,036 | 6,000 | $289,900 | $277,000 | $267 | 0.96 | 40 | 52 |
| 20481 Womack Road | Red Bluff | 1975 | 12/12/2025 | 4 | 2 | 1,296 | 10,019 | $305,000 | $322,000 | $248 | 1.06 | 64 | 52 |
| Total: 5 · Average | 3.4 | 2.0 | 1,268 | 7,298.4 | $311,800 | $311,800 | $246.8 | — | 56.8 | ||||
| Median | 1,296 | $322,000 | $322,000 | ||||||||||
Market Analysis
List vs Sale $/SqFt
Sale Price Trend
Days on Market
Sale vs List Price
This analysis was generated automatically from MLS data. For an in-depth, human-reviewed valuation, contact Joseph Sardella at josephsardella@gmail.com.