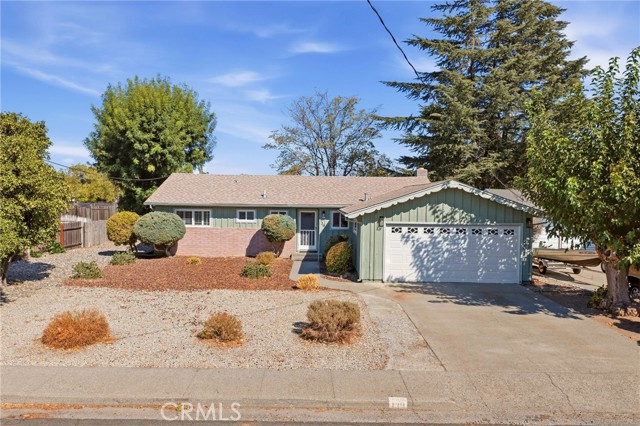
139 E Yolo Street, Orland, CA 95963
139 E Yolo Street, Orland, CA 95963
Property Description
Welcome to 139 E Yolo Street! This well-maintained home features beautiful original hardwood floors, an inviting living room, updated bathrooms, and all-new baseboards. Situated on a spacious 0.35-acre double lot that backs up to an alley, the property offers a large backyard with plenty of potential. Whether you envision adding an ADU, installing a pool, creating a garden, or designing your ideal outdoor space, there are many possibilities to explore. A charming home with character, updates, and room to make it your own.
Features & Amenities
Property Details
Mortgage Calculator
Current Rates
Comparative Market Analysis
Affordable Tier · 5 active · 5 closed
Orland · Single Family Residence
Listed in line with the median closed sale of $360,000. Price per sqft ($279) is a 12% premium to closed comps ($248).
Price Position
Aligned with the market — fair pricing for the comps.
Active Properties (5)
Active Comparables
| Address | City | Year | BD | BTH | SqFt | LotSz | LP/SqFt | LP | DIM | Score |
|---|---|---|---|---|---|---|---|---|---|---|
| 1219 Walters | Orland | 1957 | 3 | 2 | 1,212 | 9,350 | $301 | $365,000 | 3 | 90 |
| 15 Swift | Orland | 1960 | 3 | 1 | 1,280 | 8,712 | $273 | $349,900 | 26 | 90 |
| 327 EAST Street | Orland | 1977 | 3 | 2 | 1,290 | 6,969 | $275 | $355,000 | 50 | 88 |
| 1229 Marin Street | Orland | 1965 | 3 | 2 | 1,477 | 8,276 | $237 | $349,900 | 192 | 85 |
| 225 Mellane Circle | Orland | 1971 | 3 | 2 | 1,578 | 9,148 | $240 | $379,000 | 162 | 82 |
| Total: 5 · Average | 3.0 | 1.8 | 1,367.4 | 8,491 | $265.2 | $359,760 | 86.6 | |||
| Median | 1,290 | $355,000 | ||||||||
Closed Properties (5)
Closed Comparables
| Address | City | Year | Date | BD | BTH | SqFt | LotSz | LP | SP | SP/SqFt | SP/LP | DIM | Score |
|---|---|---|---|---|---|---|---|---|---|---|---|---|---|
| 1332 East Street | Orland | 1962 | 03/30/2026 | 3 | 2 | 1,223 | 9,582 | $365,000 | $360,000 | $294 | 0.99 | 52 | 90 |
| 919 East Street | Orland | 1965 | 07/13/2026 | 3 | 2 | 1,530 | 8,276 | $389,900 | $394,900 | $258 | 1.01 | 137 | 86 |
| 620 1st Street | Orland | 1955 | 09/21/2026 | 3 | 2 | 1,737 | 10,400 | $390,000 | $371,000 | $214 | 0.95 | 61 | 84 |
| 65 Colusa | Orland | 1924 | 05/13/2026 | 3 | 2 | 1,237 | 8,276 | $360,000 | $350,000 | $283 | 0.97 | 52 | 82 |
| 18 E Colusa St | Orland | 1957 | 01/16/2026 | 3 | 2 | 1,887 | 18,731 | $359,000 | $359,000 | $190 | 1.00 | 36 | 78 |
| Total: 5 · Average | 3.0 | 2.0 | 1,522.8 | 11,053 | $366,980 | $366,980 | $247.8 | — | 67.6 | ||||
| Median | 1,530 | $360,000 | $360,000 | ||||||||||
Market Analysis
List vs Sale $/SqFt
Sale Price Trend
Days on Market
Sale vs List Price
This analysis was generated automatically from MLS data. For an in-depth, human-reviewed valuation, contact Joseph Sardella at josephsardella@gmail.com.