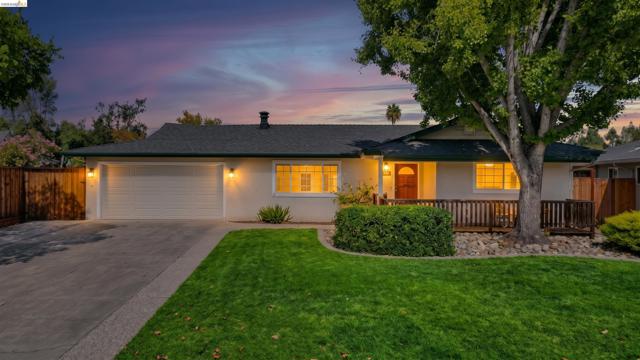
1387 Vallejo Dr, San Jose, CA 95130
1387 Vallejo Dr, San Jose, CA 95130
Property Description
Beautifully updated 3-bedroom 2-bathroom home! Nestled in a quiet sought after San Jose neighborhood between Saratoga and Campbell, this inviting home features fresh interior paint and luxurious vinyl plank flooring throughout. The spacious, 4 cars tandem deep approx. 43'x19' garage offers incredible potential for an in-law suite additional bedroom bonus room or income generating ADU. Enjoy the comfort of and efficiency of a newer HVAC system, along with a large backyard, generously sized side yard and well-built 10'x12' shed on a concrete pad. Ideally located near Hathaway Park, Westgate mall, Santana Row, Apple and Google with easy access to multiple freeways. Don't miss this fantastic opportunity!
Features & Amenities
Property Details
Mortgage Calculator
Current Rates
Comparative Market Analysis
Luxury Tier · 2 active · 5 closed
Other · San Jose · Single Family Residence
Listed in line with the median closed sale of $2,158,888. Price per sqft ($1,339) is a 15% premium to closed comps ($1,163). Closed comps sold at 104% of list — strong seller's market. Luxury tier — fewer comparable sales widen the confidence range.
Price Position
Aligned with the market — fair pricing for the comps.
Active Properties (2)
Active Comparables
| Address | City | Year | BD | BTH | SqFt | LotSz | LP/SqFt | LP | DIM | Score |
|---|---|---|---|---|---|---|---|---|---|---|
| 1165 Nadine Dr | Campbell | 1961 | 4 | 2 | 1,398 | 7,100 | $1,567 | $2.19M | 2 | 76 |
| 1036 Smith Ave | Campbell | 1961 | 4 | 3 | 1,822 | 6,200 | $1,180 | $2.15M | 45 | 62 |
| Total: 2 · Average | 4.0 | 2.5 | 1,610 | 6,650 | $1,373.5 | $2.17M | 23.5 | |||
| Median | 1,822 | $2.19M | ||||||||
Closed Properties (5)
Closed Comparables
| Address | City | Year | Date | BD | BTH | SqFt | LotSz | LP | SP | SP/SqFt | SP/LP | DIM | Score |
|---|---|---|---|---|---|---|---|---|---|---|---|---|---|
| 4162 Piper DR | San Jose | 1953 | 08/10/2026 | 3 | 2 | 1,752 | 10,425 | $2.05M | $2.03M | $1,158 | 0.99 | 98 | 79 |
| 744 Springwood | San Jose | 1963 | 07/06/2026 | 4 | 2 | 1,569 | 6,834 | $1.78M | $2.16M | $1,376 | 1.21 | 24 | 72 |
| 4765 Elmhurst Drive | San Jose | 1955 | 01/07/2026 | 6 | 3 | 1,786 | 6,120 | $2.30M | $2.30M | $1,288 | 1.00 | 54 | 70 |
| 1048 Savannah Drive | San Jose | 1956 | 09/10/2026 | 4 | 2 | 2,264 | 7,920 | $2.00M | $2.01M | $887 | 1.00 | 62 | 68 |
| 1079 Ginger Ln | San Jose | 1962 | 06/22/2026 | 5 | 3 | 2,102 | 6,000 | $2.35M | $2.32M | $1,104 | 0.99 | 61 | 50 |
| Total: 5 · Average | 4.4 | 2.4 | 1,894.6 | 7,459.8 | $2.16M | $2.16M | $1,162.6 | — | 59.8 | ||||
| Median | 1,786 | $2.16M | $2.16M | ||||||||||
Market Analysis
List vs Sale $/SqFt
Sale Price Trend
Days on Market
Sale vs List Price
This analysis was generated automatically from MLS data. For an in-depth, human-reviewed valuation, contact Joseph Sardella at josephsardella@gmail.com.