1 / 4
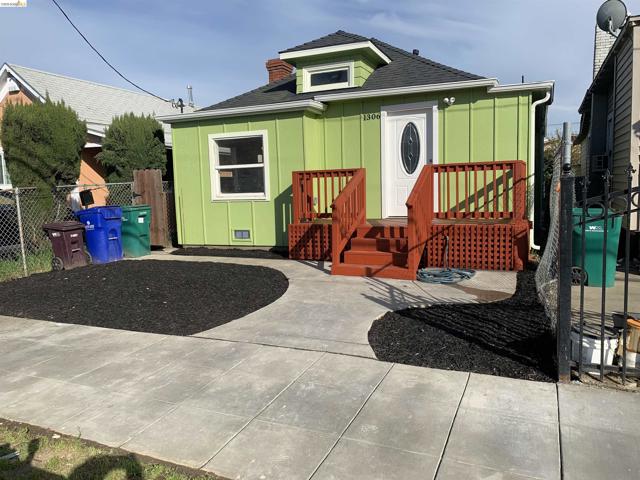
1306 53rd Avenue, Oakland, CA 94601
$535K2bd · 1ba · 850 sqft
Lot 2,850 sqft•Single Family Residence•Active•92d on market•MLS# 00-41145368
1306 53rd Avenue, Oakland, CA 94601
MLS# 00-41145368•Residential•Single Family Residence
Active92 days on market
$535,000
2
Beds
1
Baths
850
Sq Ft
2,850
Lot Sq Ft
1906
Year Built
Property Description
This is a newly renovated contemporary home within the heart of East Oakland. This renovation consisted of installing a new foundation, open concept living space, with an additional flex room added with laundry hook-ups, all items in the home are brand new. Seller motivated!
Features & Amenities
FeeBuilt 1906
Property Details
Land Type
Fee
Year Built
1906
Property Type
Residential
Property Subtype
Single Family Residence
Heating
Wall Furnace
Flooring
Laminate
City
Oakland
Zip Code
94601
County
Alameda
Mortgage Calculator
Current Rates
$
$
%
Monthly Payment
$2,705.25
Principal & Interest
Loan Amount
$428,000
Total Interest
$545,890
Total Payment Over 30 Years
$973,890
This calculator provides estimates only. Actual mortgage payments may include taxes, insurance, HOA fees, and PMI. Contact a lender for accurate quotes.
Comparative Market Analysis
Affordable Tier · 5 active · 5 closed
1306 53rd Avenue, Oakland, CA 94601
Oakland · Single Family Residence
$535K
Affordable TierBeds
2
Baths
1
Sqft
850
Lot
2,850 sqft
Year
1906
$/Sqft
$629
Pool: No✓
Listed 4.5% above the median closed sale of $512,000. Price per sqft ($629) is a 21% premium to closed comps ($520). Closed comps sold at 108% of list — strong seller's market.
Price Position
Aligned with the market — fair pricing for the comps.
At market
Subject listed at $535K· $629/sqft
Total list price
Closed comps
vs closed median $512K
+$23K (+4.5%)
Active comps
vs active median $530K
+$6K (+1.0%)
Price per sqft
Closed compsinsufficient comp data
Active comps
vs active avg $/sqft $582
+$47 (+8.1%)
Active Properties (5)
Active Comparables
| Address | City | Year | BD | BTH | SqFt | LotSz | LP/SqFt | LP | DIM | Score |
|---|---|---|---|---|---|---|---|---|---|---|
| 1960 38Th Ave | Oakland | 1911 | 2 | 1 | 843 | 3,600 | $616 | $519,500 | 22 | 87 |
| 5533 Edgerly St | Oakland | 1944 | 2 | 1 | 854 | 3,968 | $615 | $525,000 | 30 | 83 |
| 2474 Seminary Ave | Oakland | 1921 | 3 | 2 | 1,018 | 4,400 | $560 | $570,000 | 82 | 74 |
| 1434 40th | Oakland | 1915 | 3 | 3 | 1,294 | 3,850 | $409 | $529,500 | 261 | 63 |
| 1374 62Nd Ave | Oakland | 1942 | 3 | 2 | 762 | 4,000 | $709 | $540,000 | 710 | 62 |
| Total: 5 · Average | 2.6 | 1.8 | 954.2 | 3,963.6 | $581.8 | $536,800 | 221 | |||
| Median | 854 | $529,500 | ||||||||
Closed Properties (5)
Closed Comparables
| Address | City | Year | Date | BD | BTH | SqFt | LotSz | LP | SP | SP/SqFt | SP/LP | DIM | Score |
|---|---|---|---|---|---|---|---|---|---|---|---|---|---|
| 1151 58Th Ave | Oakland | 1924 | 07/30/2026 | 2 | 2 | 967 | 2,920 | $449,000 | $540,000 | $558 | 1.20 | 36 | 82 |
| 1118 61St Ave | Oakland | 1920 | 08/18/2026 | 2 | 2 | 950 | 3,500 | $499,000 | $537,000 | $565 | 1.08 | 42 | 82 |
| 1128 60Th Ave | Oakland | 1928 | 12/24/2025 | 2 | 1 | 880 | 3,500 | $449,999 | $512,000 | $582 | 1.14 | 55 | 81 |
| 1954 48Th Ave | Oakland | 1930 | 06/25/2026 | 2 | 1 | 1,060 | 2,318 | $484,900 | $490,000 | $462 | 1.01 | 101 | 78 |
| 1243 62nd Ave | Oakland | 1924 | 07/20/2026 | 2 | 1 | 1,152 | 4,000 | $525,000 | $500,000 | $434 | 0.95 | 168 | 78 |
| Total: 5 · Average | 2.0 | 1.4 | 1,001.8 | 3,247.6 | $515,800 | $515,800 | $520.2 | — | 80.4 | ||||
| Median | 967 | $512,000 | $512,000 | ||||||||||
Market Analysis
List vs Sale $/SqFt
Sale Price Trend
Days on Market
Sale vs List Price
AI-generated CMA
This analysis was generated automatically from MLS data. For an in-depth, human-reviewed valuation, contact Joseph Sardella at josephsardella@gmail.com.