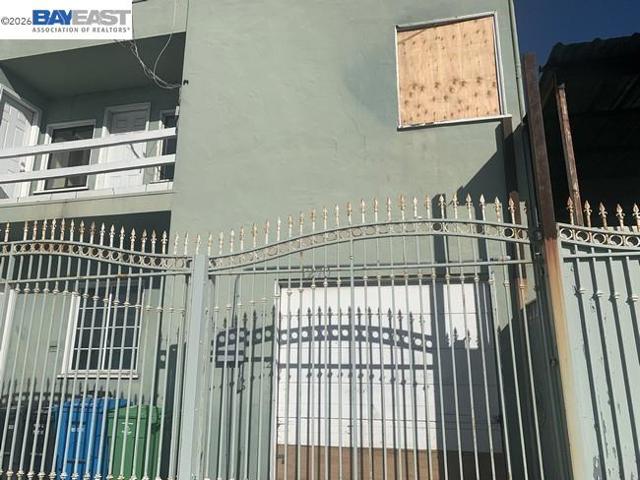
1278 Thomas Ave, San Francisco, CA 94124
1278 Thomas Ave, San Francisco, CA 94124
Property Description
Contractor Special with so much Potential !!! BIGGER than it looks & Presents a Wonderful OPPORTUNITY for Upgrading / Rebuilding. This FIXER/Upper Home Sitting in a Spacious 3 Parcels LOTS, Needs Everything, but well worth the effort to bring it back to it's original Condition and Beyond. Bring your Contractor, Architect and Imagination! The Opportunities are Endless for this Piece of Real Estate ! Property Selling "AS IS"
Features & Amenities
Property Details
Mortgage Calculator
Current Rates
Comparative Market Analysis
Residential Tier · 1 active · 5 closed
Other · San Francisco · Single Family Residence
Listed 5.6% above the median closed sale of $1,420,000. Price per sqft ($508) is a 37% discount to closed comps ($804). Closed comps sold at 111% of list — strong seller's market.
Price Position
Positioned above the market — commands a premium.
Active Properties (1)
Active Comparables
| Address | City | Year | BD | BTH | SqFt | LotSz | LP/SqFt | LP | DIM | Score |
|---|---|---|---|---|---|---|---|---|---|---|
| 247 Madrid St | San Francisco | 1922 | 5 | 3 | 1,625 | 2,500 | $916 | $1.49M | 10 | 49 |
| Total: 1 · Average | 5.0 | 3.0 | 1,625 | 2,500 | $916 | $1.49M | 10 | |||
| Median | 1,625 | $1.49M | ||||||||
Closed Properties (5)
Closed Comparables
| Address | City | Year | Date | BD | BTH | SqFt | LotSz | LP | SP | SP/SqFt | SP/LP | DIM | Score |
|---|---|---|---|---|---|---|---|---|---|---|---|---|---|
| 800 Girard St | San Francisco | 1957 | 06/24/2026 | 4 | 3 | 2,294 | 3,187 | $1.40M | $1.66M | $724 | 1.19 | 43 | 73 |
| 1430 Silliman St | San Francisco | 1945 | 08/26/2026 | 4 | 2 | 1,142 | 2,495 | $1.20M | $1.42M | $1,243 | 1.18 | 29 | 64 |
| 209 Bay Ridge Dr | Daly City | 2001 | 06/30/2026 | 5 | 4 | 2,721 | 5,000 | $1.60M | $1.61M | $592 | 1.01 | 148 | 61 |
| 1316 Bowdoin St | San Francisco | 1969 | 12/24/2025 | 5 | 3 | 1,965 | 3,150 | $1.49M | $1.30M | $662 | 0.87 | 237 | 60 |
| 657 Silver Ave | San Francisco | 1964 | 02/09/2026 | 4 | 3 | 1,595 | 5,000 | $998,000 | $1.27M | $799 | 1.28 | 90 | 57 |
| Total: 5 · Average | 4.4 | 3.0 | 1,943.4 | 3,766.4 | $1.45M | $1.45M | $804 | — | 109.4 | ||||
| Median | 1,965 | $1.42M | $1.42M | ||||||||||
Market Analysis
List vs Sale $/SqFt
Sale Price Trend
Days on Market
Sale vs List Price
This analysis was generated automatically from MLS data. For an in-depth, human-reviewed valuation, contact Joseph Sardella at josephsardella@gmail.com.