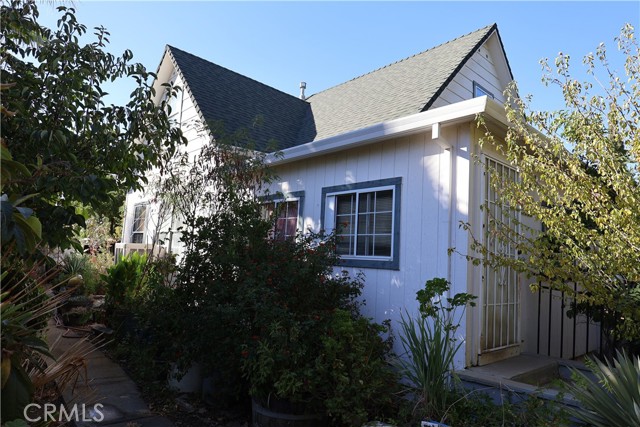
1216 Pear, Corning, CA 96021
1216 Pear, Corning, CA 96021
Property Description
Welcome to 1216 Pear St. This beautiful home sits on a huge city lot surrounded by hundreds of plants and trees. Shade and fruit trees. Agaves and cactuses. This two-story home has 4 bedrooms in total and two bathrooms. Spacious living room and a cozy kitchen. Perfect for a large family. Outdoor sheds and plenty of room for storage in the detached garage. This home has so much character. Next to an elementary school and middle school. Walking distance to a beautiful park and near a grocery store. This property has so much potential, book a showing today.
Features & Amenities
Property Details
Mortgage Calculator
Current Rates
Comparative Market Analysis
Affordable Tier · 5 active · 5 closed
Corning · Single Family Residence
Listed 6.6% above the median closed sale of $333,000. Price per sqft ($273) is a 19% premium to closed comps ($230). Closed comps sold at 103% of list — strong seller's market.
Price Position
Positioned above the market — commands a premium.
Active Properties (5)
Active Comparables
| Address | City | Year | BD | BTH | SqFt | LotSz | LP/SqFt | LP | DIM | Score |
|---|---|---|---|---|---|---|---|---|---|---|
| 716 Walnut Street | Corning | 1912 | 4 | 2 | 1,664 | 6,970 | $213 | $355,000 | 58 | 86 |
| 217 Carona Ave. | Corning | 1952 | 3 | 2 | 1,342 | 15,682 | $297 | $398,000 | 33 | 85 |
| 1409 Fig | Corning | 1922 | 4 | 1 | 1,408 | 13,068 | $234 | $329,000 | 94 | 83 |
| 693 Fripp | Corning | 2003 | 4 | 2 | 1,350 | 8,712 | $252 | $340,000 | 52 | 82 |
| 1221 Pear | Corning | 1954 | 3 | 2 | 1,156 | 10,528 | $320 | $370,000 | 81 | 81 |
| Total: 5 · Average | 3.6 | 1.8 | 1,384 | 10,992 | $263.2 | $358,400 | 63.6 | |||
| Median | 1,350 | $355,000 | ||||||||
Closed Properties (5)
Closed Comparables
| Address | City | Year | Date | BD | BTH | SqFt | LotSz | LP | SP | SP/SqFt | SP/LP | DIM | Score |
|---|---|---|---|---|---|---|---|---|---|---|---|---|---|
| 1165 Fig | Corning | 1997 | 01/02/2026 | 3 | 2 | 1,329 | 6,098 | $347,000 | $325,000 | $245 | 0.94 | 67 | 76 |
| 540 Hwy 99W | Corning | 1966 | 05/13/2026 | 4 | 2 | 1,716 | 435,600 | $389,000 | $380,000 | $221 | 0.98 | 40 | 74 |
| 1703 Yolo St | Corning | 1959 | 06/22/2026 | 3 | 1 | 910 | 6,000 | $249,000 | $320,000 | $352 | 1.28 | 66 | 68 |
| 23468 Loleta Avenue | Corning | 1962 | 12/22/2025 | 3 | 2 | 1,848 | 108,900 | $329,000 | $333,000 | $180 | 1.01 | 59 | 59 |
| 1495 SOUTH | Corning | 1910 | 12/19/2025 | 4 | 3 | 2,534 | 6,534 | $398,500 | $381,000 | $150 | 0.96 | 288 | 56 |
| Total: 5 · Average | 3.4 | 2.0 | 1,667.4 | 112,626.4 | $347,800 | $347,800 | $229.6 | — | 104 | ||||
| Median | 1,716 | $333,000 | $333,000 | ||||||||||
Market Analysis
List vs Sale $/SqFt
Sale Price Trend
Days on Market
Sale vs List Price
This analysis was generated automatically from MLS data. For an in-depth, human-reviewed valuation, contact Joseph Sardella at josephsardella@gmail.com.