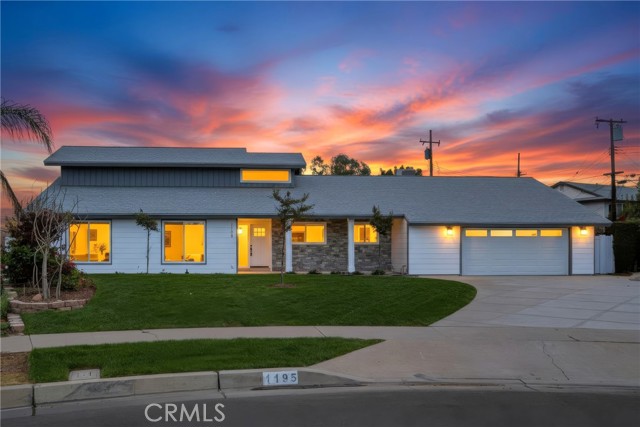
1195 North Lincoln, Orange, CA 92867
1195 North Lincoln, Orange, CA 92867
Property Description
Stunning, remodeled Orange cul-de-sac home. Shows like a model home! 4 Bedrooms plus an office. 3 Bathrooms. Two primary bedrooms, one downstairs and one upstairs. Gorgeous new kitchen featuring white oak cabinets, custom countertops and backsplash, and stainless steel appliances. Beautifully remodeled bathrooms. Extensive upgrades throughout including new flooring, interior doors, baseboards, recessed lighting, fixtures, hardware, and interior and exterior paint. New heating and air conditioning. Epoxy garage floors. Entertainer's dream resort-like backyard. Lush landscaping. Large covered outdoor living area with built-in BBQ, sink, and fireplace. Stunning pool and spa with fire features and fire pit.
Features & Amenities
Property Details
Mortgage Calculator
Current Rates
Comparative Market Analysis
Luxury Tier · 5 active · 5 closed
Not Applicable · Orange · Single Family Residence
Listed 16.5% above the median closed sale of $1,610,000. Luxury tier — fewer comparable sales widen the confidence range.
Price Position
Positioned above the market — commands a premium.
Active Properties (5)
Active Comparables
| Address | City | Year | BD | BTH | SqFt | LotSz | LP/SqFt | LP | DIM | Score |
|---|---|---|---|---|---|---|---|---|---|---|
| 1656 Shaffer | Orange | 1964 | 4 | 2 | 1,872 | 8,033 | $962 | $1.80M | 23 | 80 |
| 831 Hoover | Orange | 1961 | 5 | 3 | 2,324 | 8,190 | $710 | $1.65M | 72 | 78 |
| 2534 Washington | Orange | 1963 | 4 | 3 | 2,642 | 7,300 | $681 | $1.80M | 5 | 76 |
| 2441 Cottage Hill Drive | Orange | 1982 | 4 | 3 | 2,335 | 9,180 | $704 | $1.65M | 59 | 74 |
| 1972 Fern Street | Orange | 1964 | 4 | 4 | 3,000 | 8,640 | $632 | $1.90M | 38 | 74 |
| Total: 5 · Average | 4.2 | 3.0 | 2,434.6 | 8,268.6 | $737.8 | $1.76M | 39.4 | |||
| Median | 2,335 | $1.80M | ||||||||
Closed Properties (5)
Closed Comparables
| Address | City | Year | Date | BD | BTH | SqFt | LotSz | LP | SP | SP/SqFt | SP/LP | DIM | Score |
|---|---|---|---|---|---|---|---|---|---|---|---|---|---|
| 1760 Silverwood | Orange | 1966 | 04/30/2026 | 4 | 3 | 2,600 | 9,010 | $1.60M | $1.61M | $619 | 1.01 | 48 | 88 |
| 634 East Adams Avenue | Orange | 1957 | 07/15/2026 | 5 | 6 | 2,700 | 9,100 | $2.00M | $1.94M | $719 | 0.97 | 135 | 82 |
| 2916 Trenton Avenue | Orange | 1969 | 06/24/2026 | 4 | 3 | 2,195 | 7,125 | $1.63M | $1.60M | $729 | 0.98 | 86 | 74 |
| 626 Palmdale | Orange | 1962 | 07/24/2026 | 4 | 2 | 1,660 | 8,000 | $1.63M | $1.60M | $964 | 0.98 | 29 | 71 |
| 1492 Kathleen | Orange | 1964 | 07/13/2026 | 5 | 3 | 3,101 | 10,500 | $1.90M | $1.96M | $630 | 1.03 | 61 | 71 |
| Total: 5 · Average | 4.4 | 3.4 | 2,451.2 | 8,747 | $1.74M | $1.74M | $732.2 | — | 71.8 | ||||
| Median | 2,600 | $1.61M | $1.61M | ||||||||||
Market Analysis
List vs Sale $/SqFt
Sale Price Trend
Days on Market
Sale vs List Price
This analysis was generated automatically from MLS data. For an in-depth, human-reviewed valuation, contact Joseph Sardella at josephsardella@gmail.com.