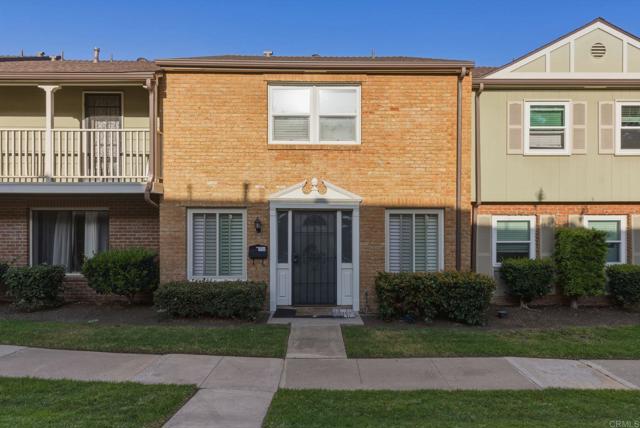
11911 Royal Road, Unit D, El Cajon, CA 92021
11911 Royal Road, Unit D, El Cajon, CA 92021
Property Description
Welcome to 11911 Royal Rd Unit D, a 3-bedroom, 2-bathroom townhome-style condominium offering 1,344 sq. ft. of living space in El Cajon's Royal Gardens community. Built in 1973, this two-story residence features one of the community's larger floor plans, with spacious living and dining areas, three bedrooms, and two full bathrooms. The kitchen includes ample cabinetry, counter space, an electric cooktop, oven, range hood, refrigerator, and in-kitchen laundry hookups. Features and improvements include freshly painted walls and ceilings, central air conditioning, forced-air heating, carpet flooring, a private concrete patio, and mountain views. Royal Gardens is a 113-unit community offering an in-ground swimming pool, playground, landscaped greenbelts, and maintained common areas. Monthly HOA dues of $523 include water, sewer, trash, and grounds maintenance. Parking includes an assigned covered carport, two uncovered spaces, and guest parking with visitor passes. Located within the Cajon Valley Union and Grossmont Union High School districts, nearby public schools include W.D. Hall Elementary (0.3 mile), Greenfield Middle (approximately 0.8 mile), and Santana High School (approximately 3 miles). Private school options include St. Kieran Catholic School and Foothills Christian High School. Shopping destinations include Target, Walmart Neighborhood Market, Home Depot, and El Cajon Town & Country Shopping Center, featuring Grocery Outlet and Dollar Tree. Parkway Plaza Mall offers JCPenney, Best Buy, dining, and Regal Cinemas. Banking options include Chase, Wells Fargo, and Bank of America. Outdoor recreation includes Flinn Springs County Park, Louis A. Stelzer County Park, and hiking at Cowles Mountain in Mission Trails Regional Park. Mission Beach is another regional recreation destination, accessible by car. Convenient access to Interstate 8 and Highway 67. Cash, conventional, and VA financing welcome. The community is reported as VA-approved, with eligible VA buyers potentially qualifying for zero-down-payment financing, subject to lender approval and applicable requirements.
Features & Amenities
Property Details
Mortgage Calculator
Current Rates
Comparative Market Analysis
Affordable Tier · 5 active · 5 closed
El Cajon · Condominium
Listed in line with the median closed sale of $610,000. Closed comps sold at 101% of list — strong seller's market.
Price Position
Aligned with the market — fair pricing for the comps.
Active Properties (5)
Active Comparables
| Address | City | Year | BD | BTH | SqFt | LotSz | LP/SqFt | LP | DIM | Score |
|---|---|---|---|---|---|---|---|---|---|---|
| 10790 Riderwood | Santee | 1986 | 3 | 3 | 1,294 | 0 | $463 | $599,000 | 9 | 71 |
| 557 Dorothy Street | El Cajon | 1989 | 3 | 3 | 1,259 | 0 | $444 | $559,000 | 29 | 67 |
| 1312 Hawk Lane | El Cajon | 1975 | 3 | 3 | 1,424 | 0 | $428 | $609,900 | 185 | 66 |
| 1465 Lexington Avenue | El Cajon | 1989 | 2 | 3 | 1,082 | 1 | $544 | $589,000 | 116 | 61 |
| 10230 Palm Glen | Santee | 1989 | 3 | 3 | 1,088 | 214,794 | $565 | $615,000 | 62 | 58 |
| Total: 5 · Average | 2.8 | 3.0 | 1,229.4 | 107,397.5 | $488.8 | $594,380 | 80.2 | |||
| Median | 1,259 | $599,000 | ||||||||
Closed Properties (5)
Closed Comparables
| Address | City | Year | Date | BD | BTH | SqFt | LotSz | LP | SP | SP/SqFt | SP/LP | DIM | Score |
|---|---|---|---|---|---|---|---|---|---|---|---|---|---|
| 1253 Mollison Avenue | El Cajon | 1973 | 10/26/2026 | 3 | 2 | 1,344 | 1,307 | $550,000 | $550,000 | $409 | 1.00 | 54 | 88 |
| 8537 Snow White Drive | El Cajon | 1986 | 05/27/2026 | 3 | 2 | 1,382 | 227,735 | $665,000 | $683,000 | $494 | 1.03 | 26 | 72 |
| 749 Mollison Ave | El Cajon | 1974 | 04/23/2026 | 3 | 2 | 1,344 | 0 | $525,000 | $535,000 | $398 | 1.02 | 91 | 69 |
| 10330 Rosie Lane | Santee | 1978 | 09/04/2026 | 3 | 2 | 1,303 | 3,107 | $663,000 | $663,000 | $509 | 1.00 | 47 | 67 |
| 514 Jamacha Rd | El Cajon | 1985 | 05/15/2026 | 3 | 3 | 1,420 | 0 | $599,000 | $610,000 | $430 | 1.02 | 123 | 67 |
| Total: 5 · Average | 3.0 | 2.2 | 1,358.6 | 77,383 | $608,200 | $608,200 | $448 | — | 68.2 | ||||
| Median | 1,344 | $610,000 | $610,000 | ||||||||||
Market Analysis
List vs Sale $/SqFt
Sale Price Trend
Days on Market
Sale vs List Price
This analysis was generated automatically from MLS data. For an in-depth, human-reviewed valuation, contact Joseph Sardella at josephsardella@gmail.com.