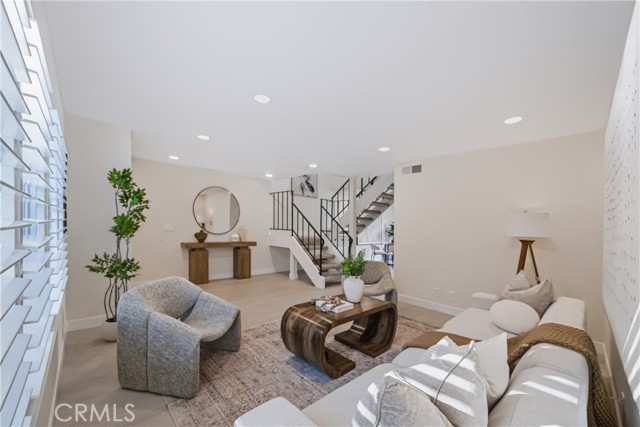
1179 Green Glen, San Jose, CA 95126
1179 Green Glen, San Jose, CA 95126
Property Description
Welcome to the sought after Willow Glen area of San Jose. This beautifully updated townhome offers nearly 1,500 square feet of living space with three (3) bedrooms and two and a half baths (2.5), plus a private patio courtyard and detached two car garage. It's been refreshed from top to bottom with new flooring, new carpet, fresh paint and new shutters, so it is ready for you on day one. The sellers took great care to make sure that when the keys change hands, the new homeowners feel the love that's gone into this home. Step outside into welcoming community surrounded by lush greenery, walking paths, open lawns, a sparkling pool and a relaxing hot tub spa. Come by take a look and see what could be yours. Offers due Wednesday, Nov., 18, 12 PM
Features & Amenities
Property Details
Mortgage Calculator
Current Rates
Comparative Market Analysis
Affordable Tier · 1 active · 3 closed
San Jose · Condominium
Listed 11.4% above the median closed sale of $808,000. Price per sqft ($612) is a 17% discount to closed comps ($736).
Price Position
Positioned above the market — commands a premium.
Active Properties (1)
Active Comparables
| Address | City | Year | BD | BTH | SqFt | LotSz | LP/SqFt | LP | DIM | Score |
|---|---|---|---|---|---|---|---|---|---|---|
| 169 Laurel Grove | San Jose | 2004 | 4 | 3 | 1,650 | 577 | $605 | $999,000 | 95 | 69 |
| Total: 1 · Average | 4.0 | 3.0 | 1,650 | 577 | $605 | $999,000 | 95 | |||
| Median | 1,650 | $999,000 | ||||||||
Closed Properties (3)
Closed Comparables
| Address | City | Year | Date | BD | BTH | SqFt | LotSz | LP | SP | SP/SqFt | SP/LP | DIM | Score |
|---|---|---|---|---|---|---|---|---|---|---|---|---|---|
| 1343 McKinley Ct | San Jose | 2007 | 07/20/2026 | 3 | 3 | 1,311 | 1,581 | $999,000 | $975,000 | $744 | 0.98 | 61 | 84 |
| 3855 Panda Pl | San Jose | 1986 | 05/29/2026 | 2 | 2 | 1,199 | 1,400 | $775,000 | $775,000 | $646 | 1.00 | 41 | 55 |
| 801 Winchester Blvd | San Jose | 2005 | 10/28/2025 | 2 | 2 | 986 | 892 | $808,000 | $808,000 | $819 | 1.00 | 27 | 53 |
| Total: 3 · Average | 2.3 | 2.3 | 1,165.333 | 1,291 | $852,666.667 | $852,666.667 | $736.333 | — | 43 | ||||
| Median | 1,199 | $808,000 | $808,000 | ||||||||||
Market Analysis
List vs Sale $/SqFt
Sale Price Trend
Days on Market
Sale vs List Price
This analysis was generated automatically from MLS data. For an in-depth, human-reviewed valuation, contact Joseph Sardella at josephsardella@gmail.com.