1 / 1
11625 Ranchito, El Monte, CA 91732
$725K2bd · 1ba · 1,137 sqft
Lot 14,799 sqft•Single Family Residence•Active•15d on market•MLS# WS-26236598
11625 Ranchito, El Monte, CA 91732
MLS# WS-26236598•Residential•Single Family Residence
Active15 days on market
$725,000
2
Beds
1
Baths
1,137
Sq Ft
14,799
Lot Sq Ft
1937
Year Built
None
View
Property Description
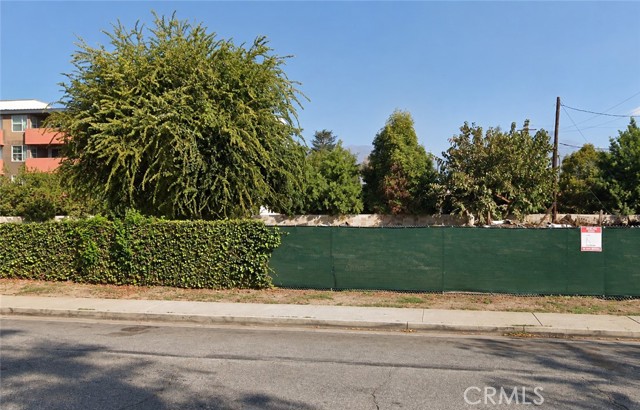
Land value only. 11625 Ranchito St is being sold together with 11619 Ranchito St (APN 8547-014-019). Property is located within mixed-use zoning, offering potential for a variety of permitted uses subject to applicable regulations.
Features & Amenities
FeeBuilt 1937
Property Details
Land Type
Fee
Year Built
1937
Property Type
Residential
Property Subtype
Single Family Residence
Parking Spaces
0
Garage Spaces
0
Cooling
None
View
None
City
El Monte
Zip Code
91732
County
Los Angeles
Mortgage Calculator
Current Rates
$
$
%
Monthly Payment
$3,665.99
Principal & Interest
Loan Amount
$580,000
Total Interest
$739,758
Total Payment Over 30 Years
$1,319,758
This calculator provides estimates only. Actual mortgage payments may include taxes, insurance, HOA fees, and PMI. Contact a lender for accurate quotes.
Comparative Market Analysis
Affordable Tier · 5 active · 5 closed
11625 Ranchito, El Monte, CA 91732
El Monte · Single Family Residence
$725K
Affordable TierBeds
2
Baths
1
Sqft
1,137
Lot
14,799 sqft
Year
1937
$/Sqft
$638
Pool: No✓
View: None✓
Listed in line with the median closed sale of $735,000. Closed comps sold at 103% of list — strong seller's market.
Price Position
Aligned with the market — fair pricing for the comps.
At market
Subject listed at $725K· $638/sqft
Total list price
Closed comps
vs closed median $735K
−$10K (−1.4%)
Active comps
vs active median $699K
+$26K (+3.7%)
Price per sqft
Closed compsinsufficient comp data
Active comps
vs active avg $/sqft $650
−$12 (−1.8%)
Active Properties (5)
Active Comparables
| Address | City | Year | BD | BTH | SqFt | LotSz | LP/SqFt | LP | DIM | Score |
|---|---|---|---|---|---|---|---|---|---|---|
| 11402 Basye Street | El Monte | 1943 | 3 | 1 | 1,224 | 6,269 | $531 | $650,000 | 20 | 83 |
| 11823 Basye | El Monte | 1964 | 3 | 2 | 1,166 | 5,444 | $592 | $689,999 | 88 | 74 |
| 4121 Instar Place | El Monte | 1947 | 3 | 2 | 1,567 | 7,800 | $446 | $699,000 | 10 | 72 |
| 4331 Maxson Rd. | El Monte | 1963 | 3 | 2 | 1,240 | 4,799 | $619 | $768,000 | 233 | 69 |
| 10966 Emery | El Monte | 1953 | 3 | 2 | 720 | 5,523 | $1,062 | $765,000 | 27 | 68 |
| Total: 5 · Average | 3.0 | 1.8 | 1,183.4 | 5,967 | $650 | $714,399.8 | 75.6 | |||
| Median | 1,224 | $699,000 | ||||||||
Closed Properties (5)
Closed Comparables
| Address | City | Year | Date | BD | BTH | SqFt | LotSz | LP | SP | SP/SqFt | SP/LP | DIM | Score |
|---|---|---|---|---|---|---|---|---|---|---|---|---|---|
| 11704 Emery Street | El Monte | 1936 | 10/06/2026 | 3 | 1 | 924 | 13,740 | $700,000 | $782,000 | $846 | 1.12 | 19 | 88 |
| 11922 Killian Street | El Monte | 1939 | 07/21/2026 | 3 | 2 | 1,333 | 6,062 | $688,000 | $708,000 | $531 | 1.03 | 60 | 79 |
| 11637 Ranchito | El Monte | 1966 | 09/16/2026 | 3 | 2 | 1,186 | 5,834 | $759,000 | $780,000 | $658 | 1.03 | 22 | 79 |
| 11433 Hallwood Drive | El Monte | 1961 | 11/04/2026 | 3 | 2 | 1,144 | 5,408 | $725,000 | $735,000 | $642 | 1.01 | 34 | 79 |
| 5015 La Madera | El Monte | 1948 | 11/13/2026 | 3 | 2 | 1,396 | 6,031 | $725,000 | $715,000 | $512 | 0.99 | 36 | 78 |
| Total: 5 · Average | 3.0 | 1.8 | 1,196.6 | 7,415 | $744,000 | $744,000 | $637.8 | — | 34.2 | ||||
| Median | 1,186 | $735,000 | $735,000 | ||||||||||
Market Analysis
List vs Sale $/SqFt
Sale Price Trend
Days on Market
Sale vs List Price
AI-generated CMA
This analysis was generated automatically from MLS data. For an in-depth, human-reviewed valuation, contact Joseph Sardella at josephsardella@gmail.com.