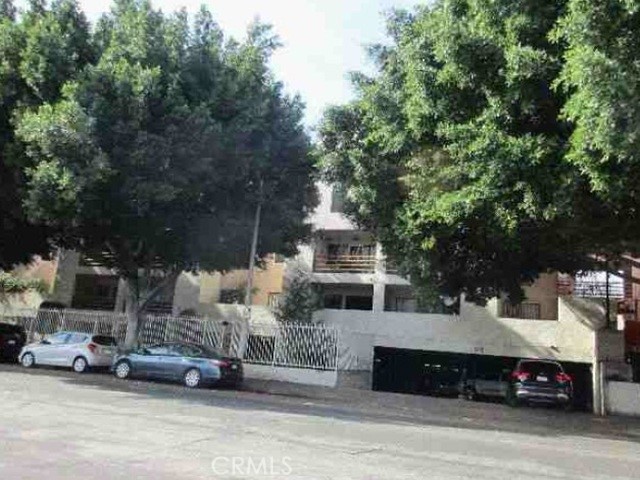
1119 Albany Street, 337, Los Angeles, CA 90015
1119 Albany Street, 337, Los Angeles, CA 90015
Property Description
Investment opportunity walking distance to major attractions in Los Angeles. Imagine walking to the conventional center or Staples Center to watch a game. Built in 1983 this one bedroom has approx. 845 sq. ft. If you blink it will be SOLD at this price. Buyers check City, County, Zoning, Tax, and other records to their satisfaction. AS-IS SALE property.
Features & Amenities
Property Details
Mortgage Calculator
Current Rates
Comparative Market Analysis
Affordable Tier · 2 active · 2 closed
Los Angeles · Condominium
Listed 10.1% below the median closed sale of $209,000. Price per sqft ($222) is a 49% discount to closed comps ($436). Closed comps sold at 102% of list — strong seller's market.
Price Position
Priced below the market — value advantage over the field.
Active Properties (2)
Active Comparables
| Address | City | Year | BD | BTH | SqFt | LotSz | LP/SqFt | LP | DIM | Score |
|---|---|---|---|---|---|---|---|---|---|---|
| 2121 James M Wood | Los Angeles | 1923 | 0 | 1 | 370 | 21,313 | $540 | $199,900 | 25 | 66 |
| 2121 James M Wood Boulevard | Los Angeles | 1923 | 0 | 1 | 380 | 21,313 | $513 | $195,000 | 26 | 66 |
| Total: 2 · Average | 0.0 | 1.0 | 375 | 21,313 | $526.5 | $197,450 | 25.5 | |||
| Median | 380 | $199,900 | ||||||||
Closed Properties (2)
Closed Comparables
| Address | City | Year | Date | BD | BTH | SqFt | LotSz | LP | SP | SP/SqFt | SP/LP | DIM | Score |
|---|---|---|---|---|---|---|---|---|---|---|---|---|---|
| 1119 Albany | Los Angeles | 1983 | 10/07/2026 | 1 | 1 | 650 | 147,380 | $200,000 | $210,000 | $323 | 1.05 | 40 | 94 |
| 320 Ardmore Avenue | Los Angeles | 1973 | 10/21/2026 | 0 | 1 | 378 | 43,946 | $210,000 | $208,000 | $550 | 0.99 | 156 | 58 |
| Total: 2 · Average | 0.5 | 1.0 | 514 | 95,663 | $209,000 | $209,000 | $436.5 | — | 98 | ||||
| Median | 650 | $210,000 | $210,000 | ||||||||||
Market Analysis
List vs Sale $/SqFt
Sale Price Trend
Days on Market
Sale vs List Price
This analysis was generated automatically from MLS data. For an in-depth, human-reviewed valuation, contact Joseph Sardella at josephsardella@gmail.com.