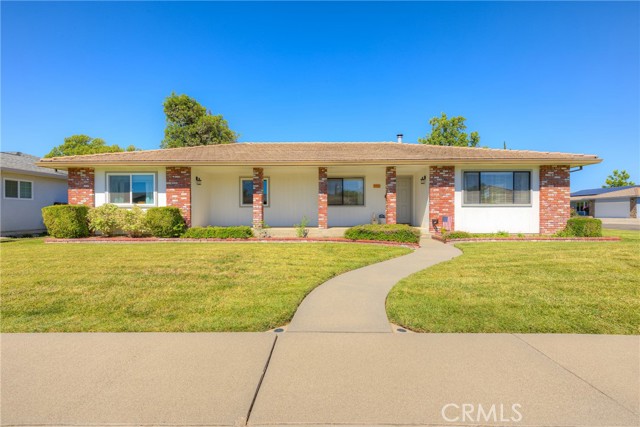
110 Rennat, Orland, CA 95963
110 Rennat, Orland, CA 95963
Property Description
OWNED SOLAR! Welcome to one of Orland's most desirable neighborhoods — and this corner lot home has been transformed from the inside out. Since 2020, the sellers have invested heavily in upgrades that matter: new flooring, fresh interior paint, updated light fixtures, outlets, and wall switches throughout. New windows on half the home bring in natural light while improving energy efficiency. New baseboards, closet doors, and ceiling fans give every room a clean, finished feel. The kitchen has been updated with new appliances, and the master bath features a brand-new shower. Step outside to an extended cement patio with a walkway — ideal for entertaining or relaxing on a generous corner lot. The big-ticket items are covered too: new HVAC, new garage door and motor, and a whole house fan to keep things comfortable year-round. This is a move-in ready home in a neighborhood people want to be in. Don't miss it.
Features & Amenities
Property Details
Mortgage Calculator
Current Rates
Comparative Market Analysis
Affordable Tier · 5 active · 5 closed
Orland · Single Family Residence
Listed 7.0% above the median closed sale of $430,000.
Price Position
Positioned above the market — commands a premium.
Active Properties (5)
Active Comparables
| Address | City | Year | BD | BTH | SqFt | LotSz | LP/SqFt | LP | DIM | Score |
|---|---|---|---|---|---|---|---|---|---|---|
| 106 Rennat Way | Orland | 1996 | 3 | 2 | 1,725 | 9,148 | $246 | $425,000 | 33 | 95 |
| 634 Salomon Dr | Orland | 2006 | 3 | 3 | 1,762 | 7,134 | $227 | $400,000 | 72 | 85 |
| 689 Apricot Circle | Orland | 2024 | 3 | 2 | 1,471 | 6,970 | $303 | $445,000 | 124 | 85 |
| 866 Watts | Orland | 2017 | 3 | 2 | 1,601 | 5,283 | $265 | $425,000 | 41 | 84 |
| 415 1st | Orland | 1950 | 2 | 2 | 1,496 | 10,454 | $301 | $450,000 | 90 | 78 |
| Total: 5 · Average | 2.8 | 2.2 | 1,611 | 7,797.8 | $268.4 | $429,000 | 72 | |||
| Median | 1,601 | $425,000 | ||||||||
Closed Properties (5)
Closed Comparables
| Address | City | Year | Date | BD | BTH | SqFt | LotSz | LP | SP | SP/SqFt | SP/LP | DIM | Score |
|---|---|---|---|---|---|---|---|---|---|---|---|---|---|
| 919 East Street | Orland | 1965 | 07/13/2026 | 3 | 2 | 1,530 | 8,276 | $389,900 | $394,900 | $258 | 1.01 | 137 | 80 |
| 4335 County Road H | Orland | 1982 | 09/25/2026 | 3 | 2 | 1,470 | 253,955 | $499,000 | $499,000 | $339 | 1.00 | 49 | 76 |
| 1528 Maplewood | Orland | 2017 | 09/21/2026 | 3 | 2 | 1,430 | 6,970 | $389,000 | $395,000 | $276 | 1.01 | 70 | 74 |
| 4670 County Road Ff | Orland | 1991 | 08/12/2026 | 3 | 2 | 1,639 | 82,764 | $495,000 | $500,000 | $305 | 1.01 | 47 | 74 |
| 1542 Oakwood Drive | Orland | 2023 | 07/02/2026 | 3 | 2 | 1,501 | 7,841 | $450,000 | $430,000 | $286 | 0.96 | 87 | 73 |
| Total: 5 · Average | 3.0 | 2.0 | 1,514 | 71,961.2 | $443,780 | $443,780 | $292.8 | — | 78 | ||||
| Median | 1,501 | $430,000 | $430,000 | ||||||||||
Market Analysis
List vs Sale $/SqFt
Sale Price Trend
Days on Market
Sale vs List Price
This analysis was generated automatically from MLS data. For an in-depth, human-reviewed valuation, contact Joseph Sardella at josephsardella@gmail.com.