10611 Garibaldi, California City, CA 93505
10611 Garibaldi, California City, CA 93505
Property Description
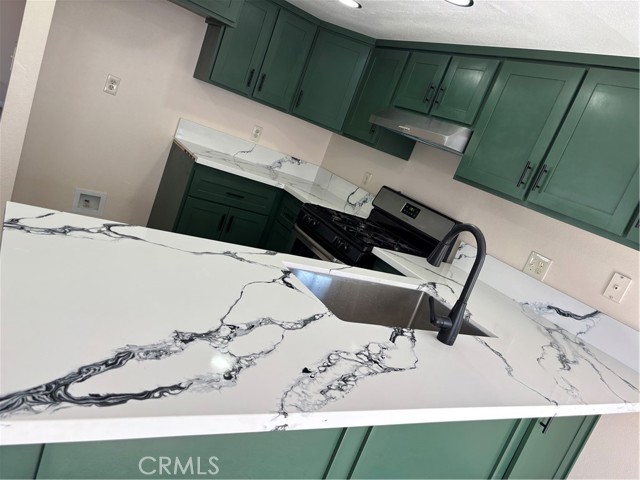
'Thoughtfully redesigned for modern living, this fully renovated home boasts a bright, airy floor plan perfect for entertaining. The gourmet kitchen serves as the heart of the home, flowing seamlessly into the spacious living areas. From the designer bathrooms to the fresh flooring and paint, every inch of this home has been elevated.The backyard offers great potential for outdoor enjoyment. Conveniently located near schools, shopping, and major commuter routes. A great opportunity to own a move-in ready home with plenty of potential.
Features & Amenities
Property Details
Mortgage Calculator
Current Rates
Comparative Market Analysis
Affordable Tier · 5 active · 5 closed
California City · Single Family Residence
Listed in line with the median closed sale of $270,000. Expect a longer timeline — comps averaged 163 days on market.
Price Position
Aligned with the market — fair pricing for the comps.
Active Properties (5)
Active Comparables
| Address | City | Year | BD | BTH | SqFt | LotSz | LP/SqFt | LP | DIM | Score |
|---|---|---|---|---|---|---|---|---|---|---|
| 10331 Loop Boulevard | California City | 1987 | 3 | 2 | 1,828 | 11,240 | $146 | $266,000 | 83 | 86 |
| 21125 Conklin | California City | 1989 | 3 | 2 | 1,422 | 4,361 | $196 | $279,000 | 40 | 84 |
| 10016 Mendiburu | California City | 2021 | 4 | 2 | 1,498 | 11,174 | $200 | $299,900 | 37 | 81 |
| 9331 Karen | California City | 1990 | 3 | 2 | 1,715 | 7,841 | $157 | $269,000 | 65 | 81 |
| 21648 95th | California City | 2007 | 3 | 2 | 1,656 | 10,253 | $171 | $282,900 | 65 | 79 |
| Total: 5 · Average | 3.2 | 2.0 | 1,623.8 | 8,973.8 | $174 | $279,360 | 58 | |||
| Median | 1,656 | $279,000 | ||||||||
Closed Properties (5)
Closed Comparables
| Address | City | Year | Date | BD | BTH | SqFt | LotSz | LP | SP | SP/SqFt | SP/LP | DIM | Score |
|---|---|---|---|---|---|---|---|---|---|---|---|---|---|
| 10130 Evelyn | California City | 1988 | 10/16/2026 | 3 | 2 | 1,569 | 11,326 | $279,900 | $270,000 | $172 | 0.96 | 49 | 90 |
| 21640 Garibaldi Ct | California City | 1989 | 10/15/2026 | 3 | 2 | 1,862 | 10,200 | $260,000 | $255,500 | $137 | 0.98 | 83 | 88 |
| 9840 Margery Avenue | California City | 1990 | 04/28/2026 | 3 | 2 | 1,625 | 10,454 | $275,000 | $275,000 | $169 | 1.00 | 455 | 86 |
| 21745 Upton Drive | California City | 2007 | 04/24/2026 | 3 | 2 | 1,514 | 9,320 | $305,000 | $300,000 | $198 | 0.98 | 142 | 85 |
| 21265 Windsong | California City | 1989 | 07/29/2026 | 3 | 3 | 1,591 | 4,968 | $228,000 | $234,000 | $147 | 1.03 | 88 | 81 |
| Total: 5 · Average | 3.0 | 2.2 | 1,632.2 | 9,253.6 | $266,900 | $266,900 | $164.6 | — | 163.4 | ||||
| Median | 1,591 | $270,000 | $270,000 | ||||||||||
Market Analysis
List vs Sale $/SqFt
Sale Price Trend
Days on Market
Sale vs List Price
This analysis was generated automatically from MLS data. For an in-depth, human-reviewed valuation, contact Joseph Sardella at josephsardella@gmail.com.